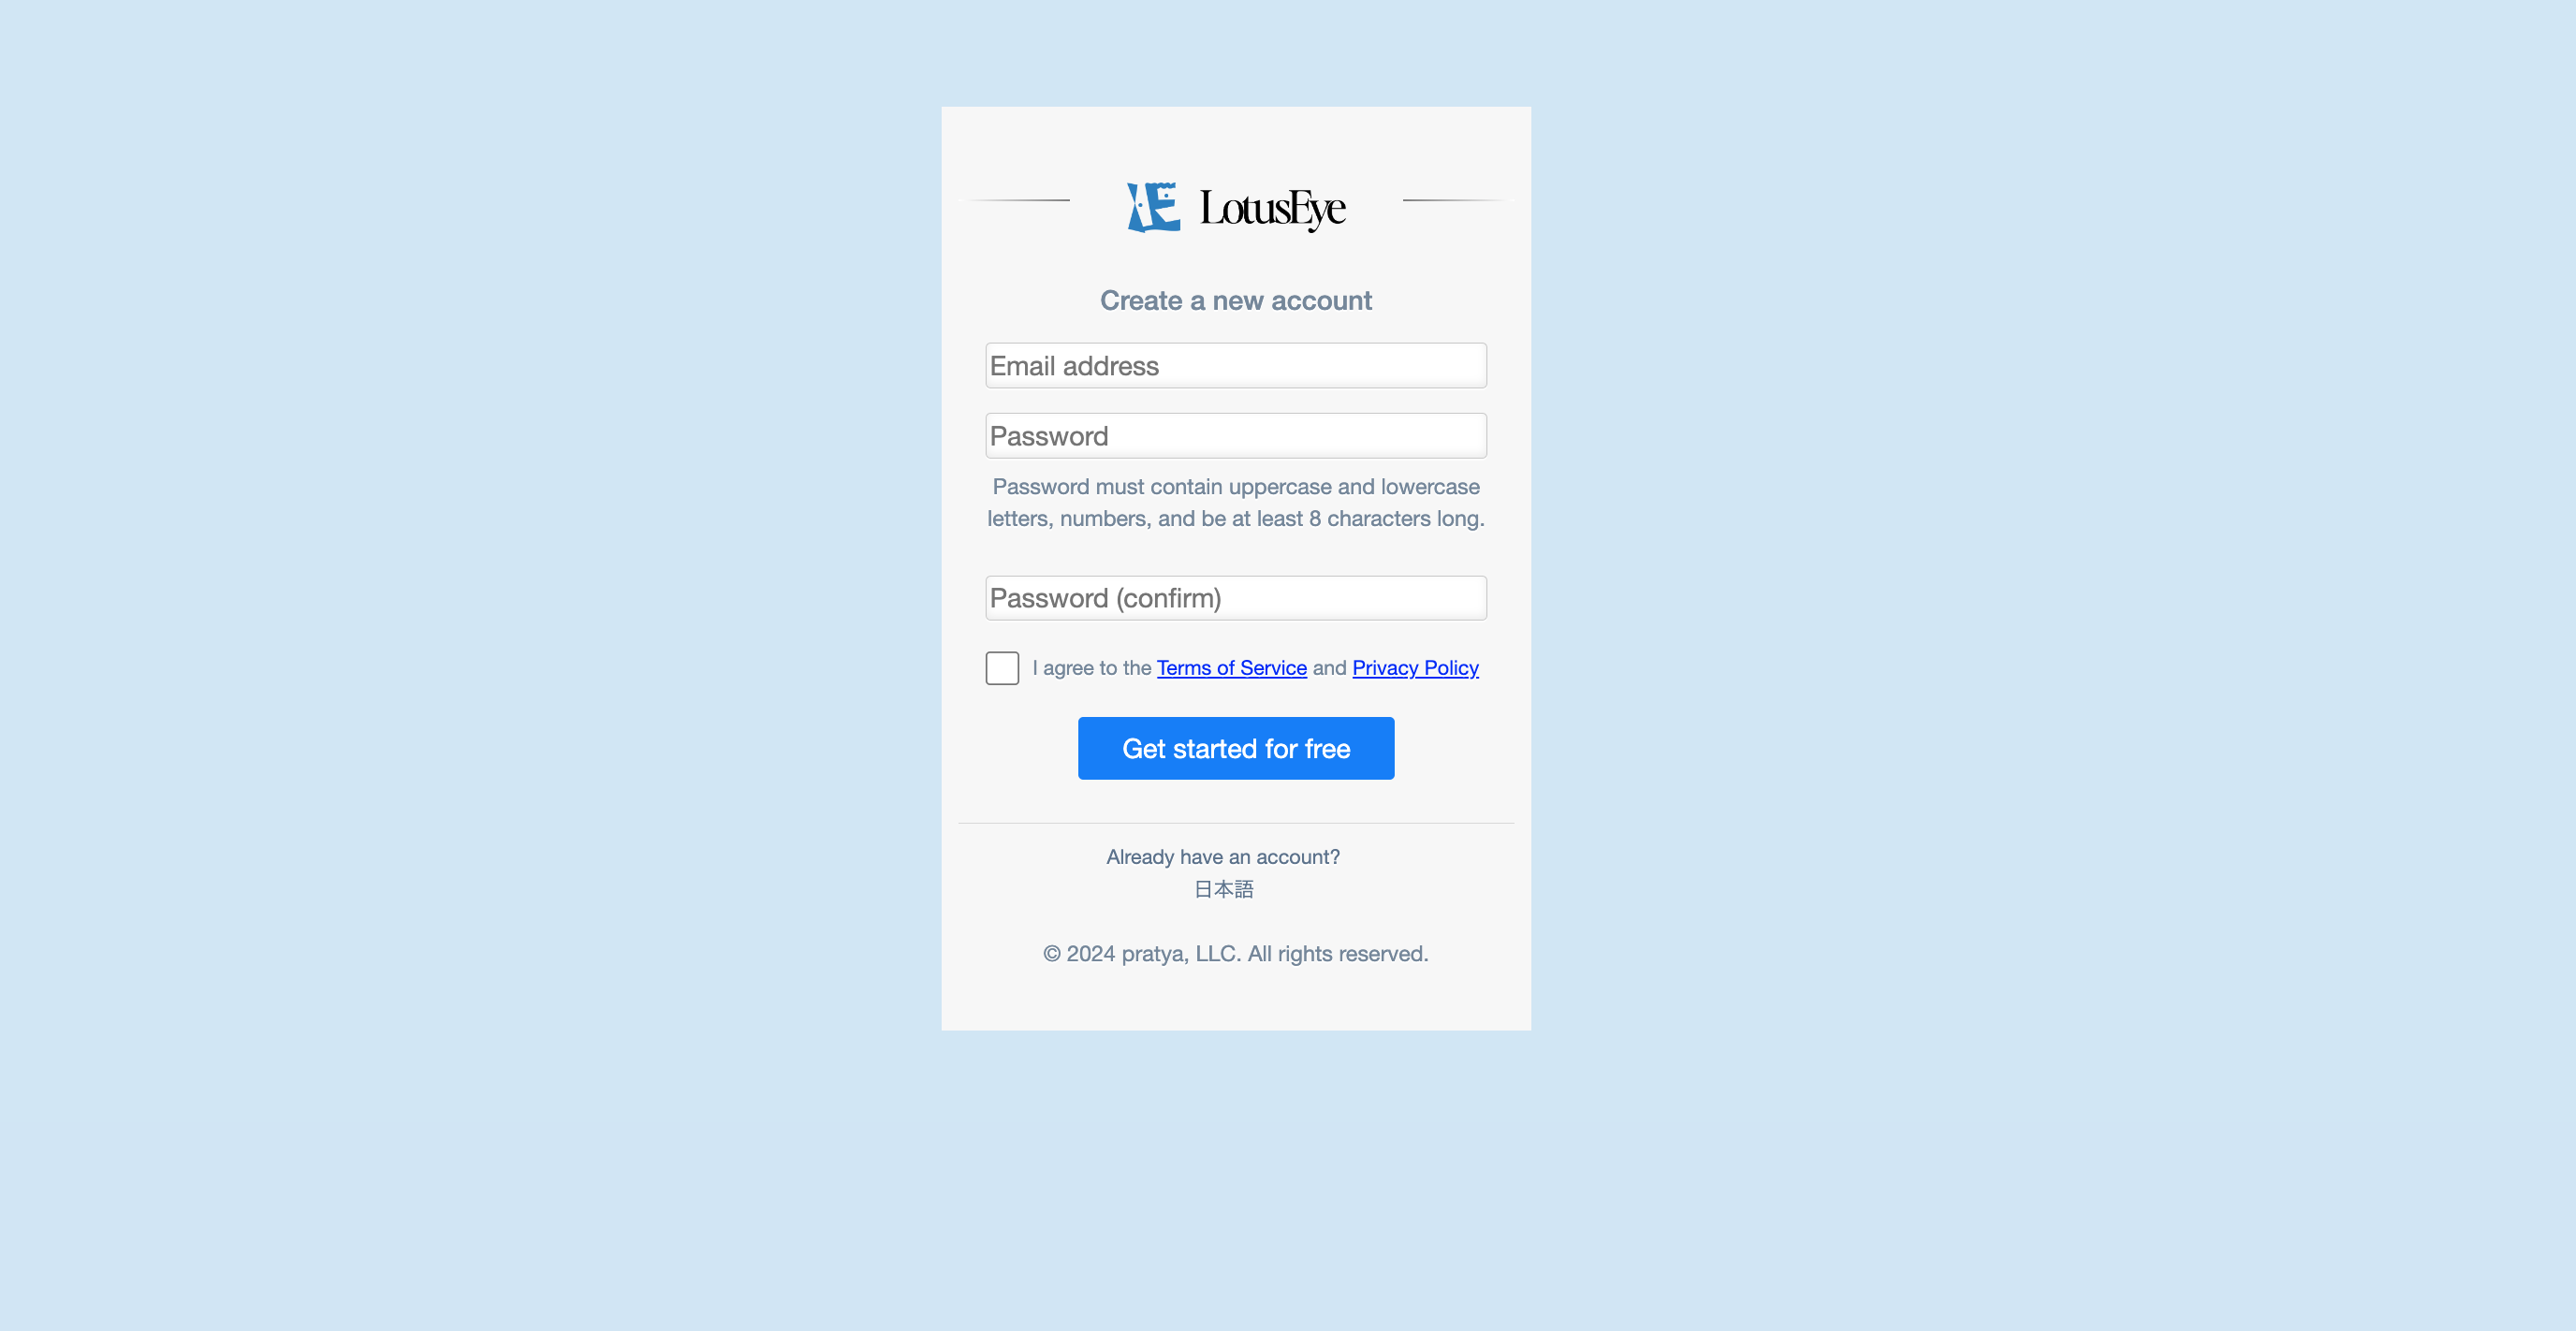
Enter your account information as follows and click the "Create Account" button.
- Username: The name you will use on the service
- Email address: Your email address. This will also be used as your login ID
- Company name: Your company or organization name
- Password: Please enter at least 8 alphanumeric characters
- Password (confirmation): Please enter it again for confirmation
A temporary registration completion email will be sent to the registered email address
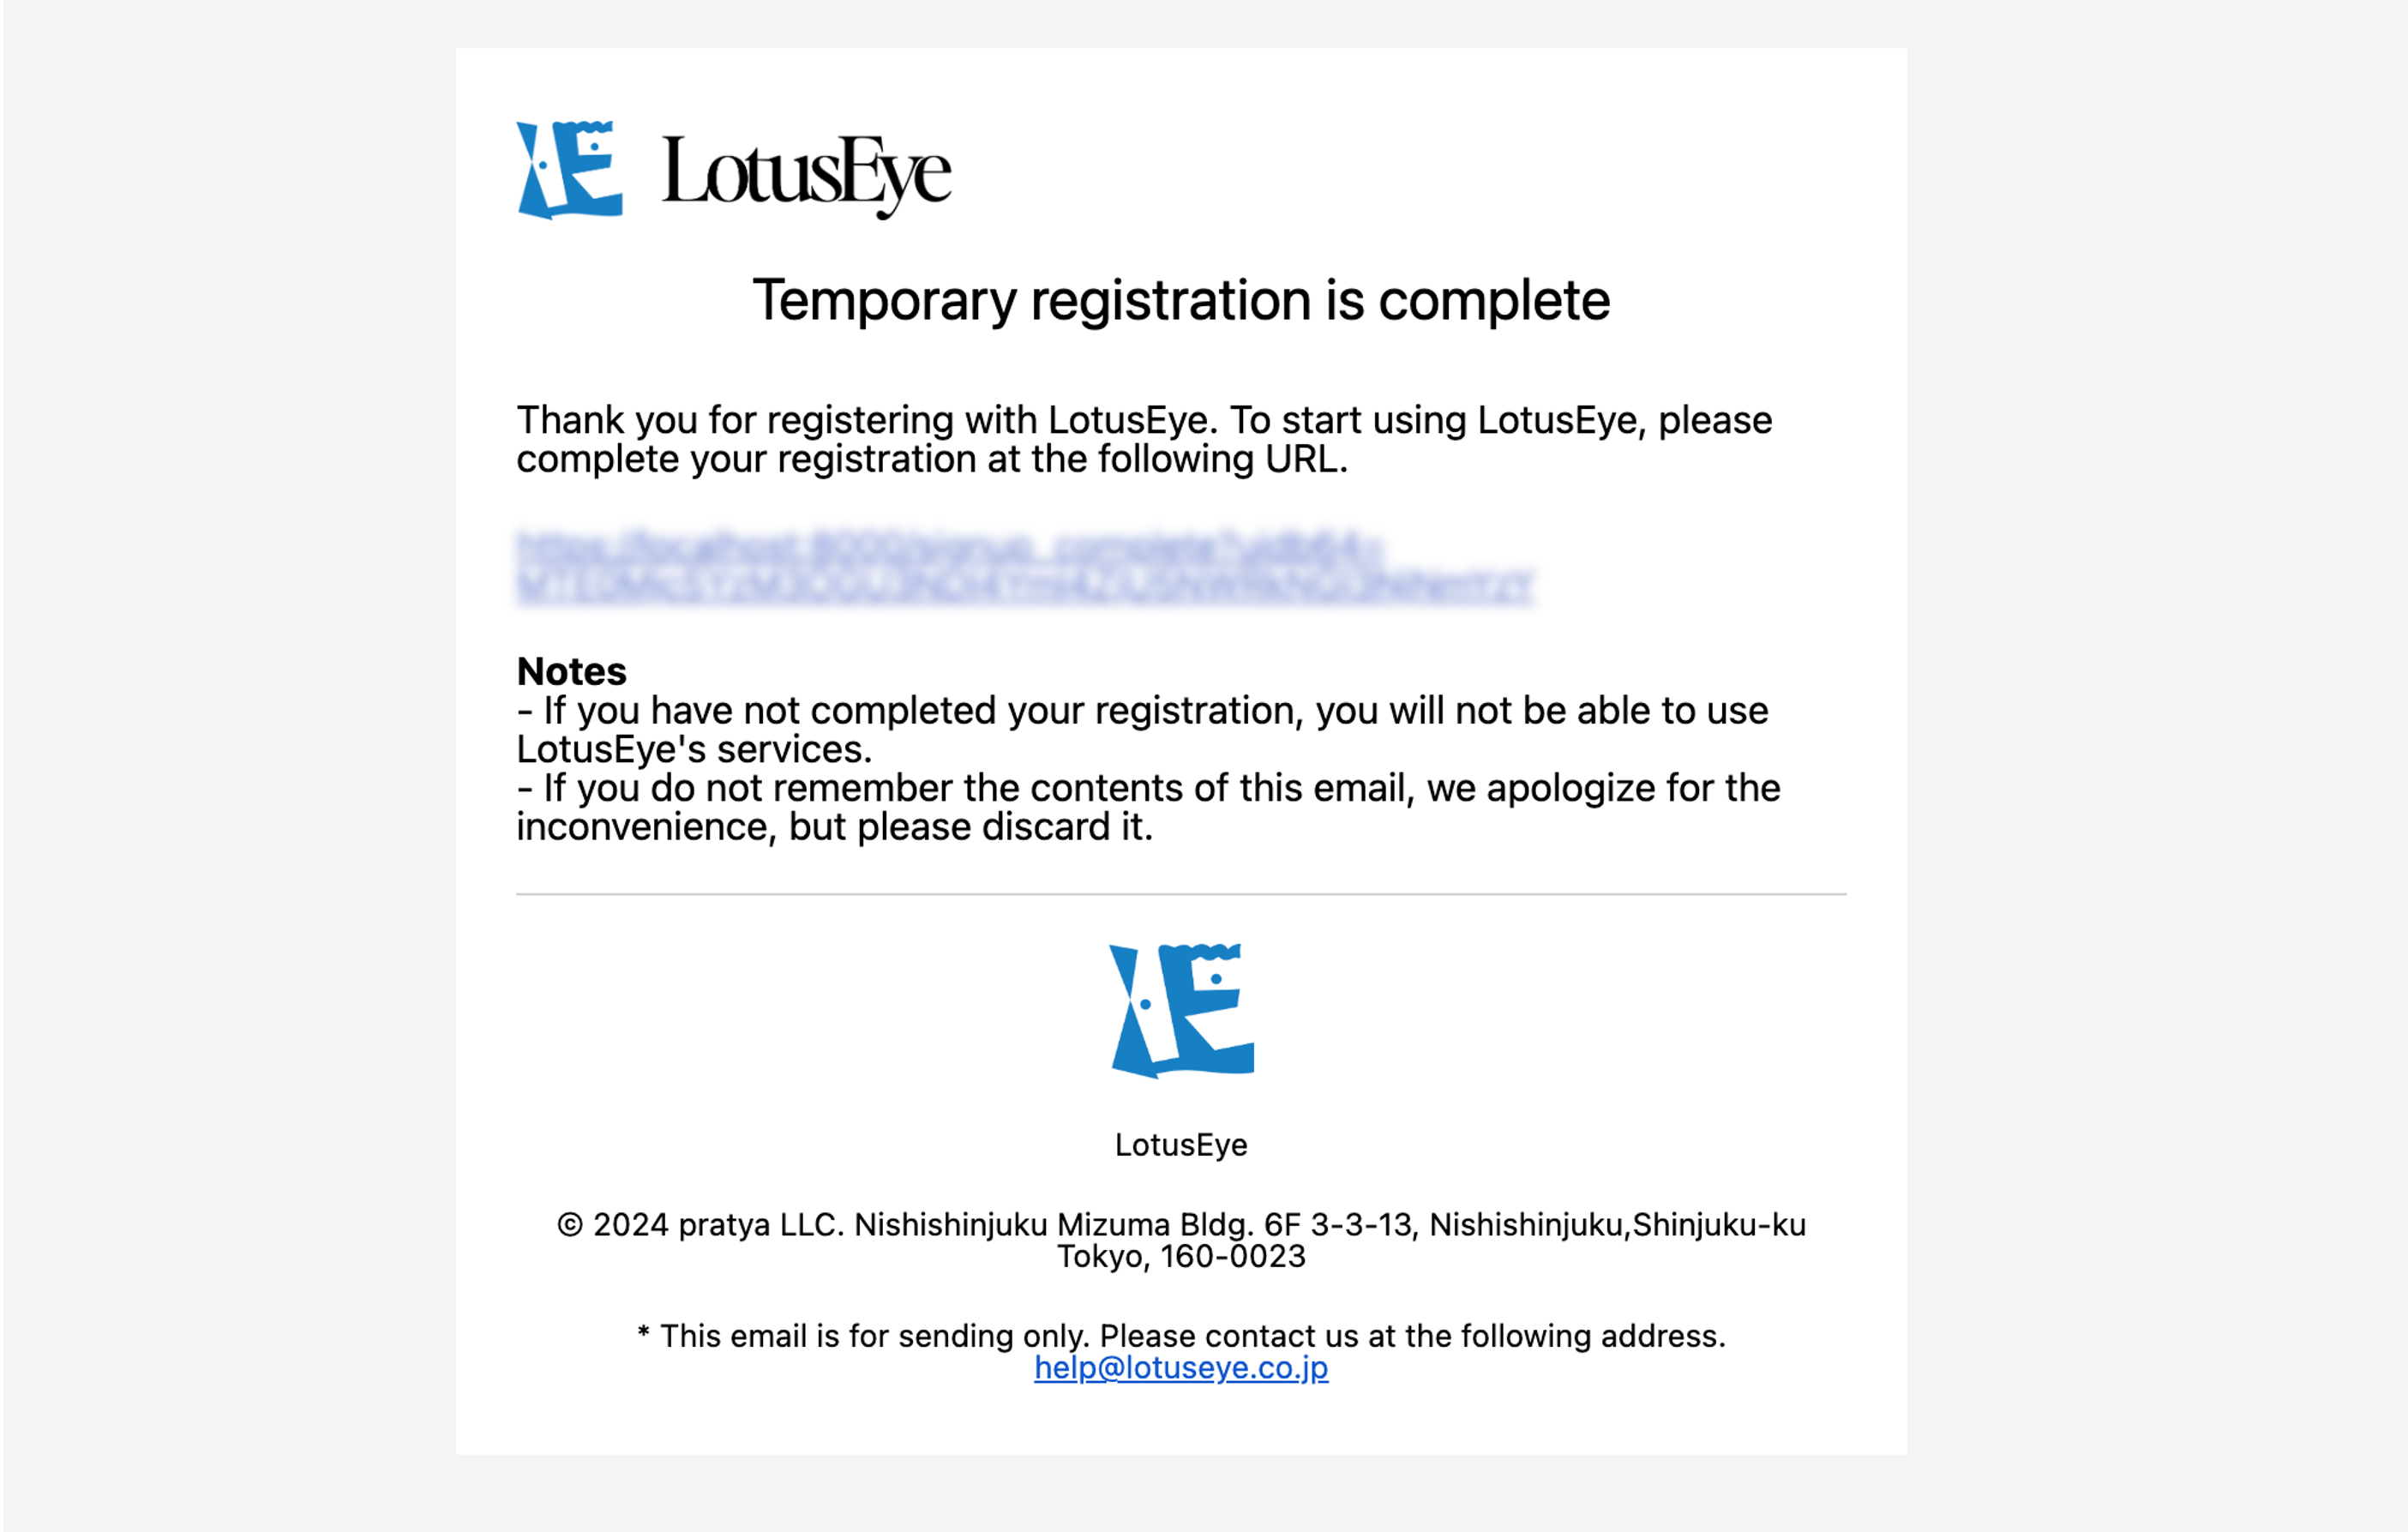
Click the URL in the temporary registration completion email to complete your registration
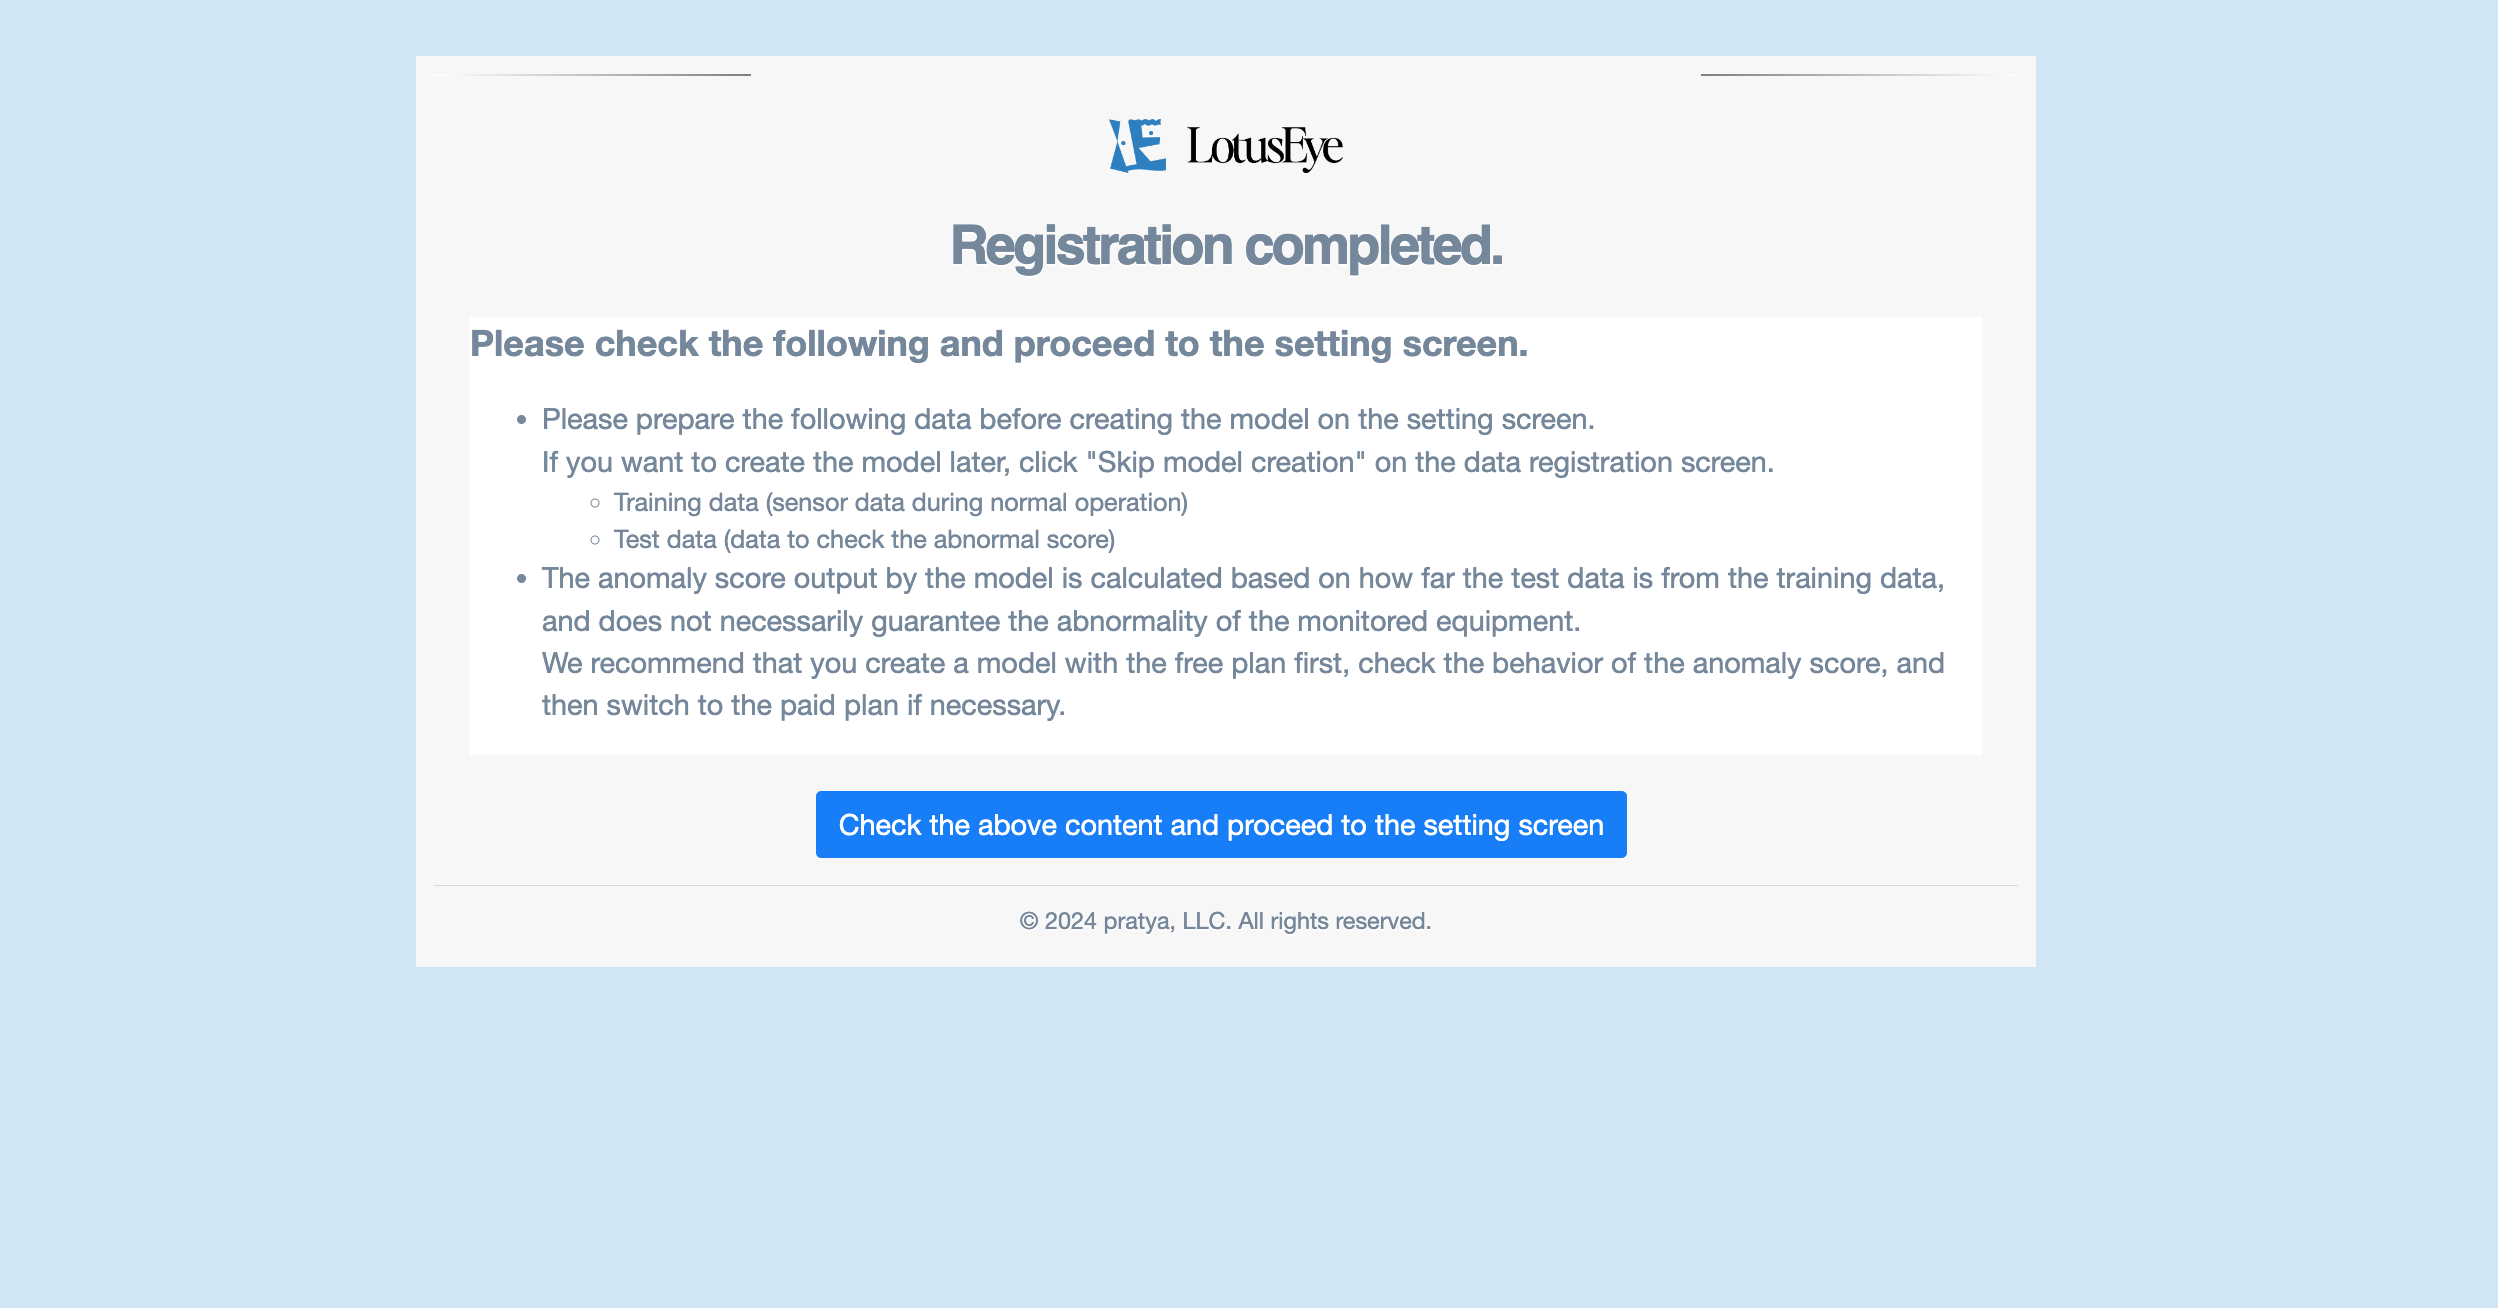
Please confirm the precautions and proceed to the initial setup
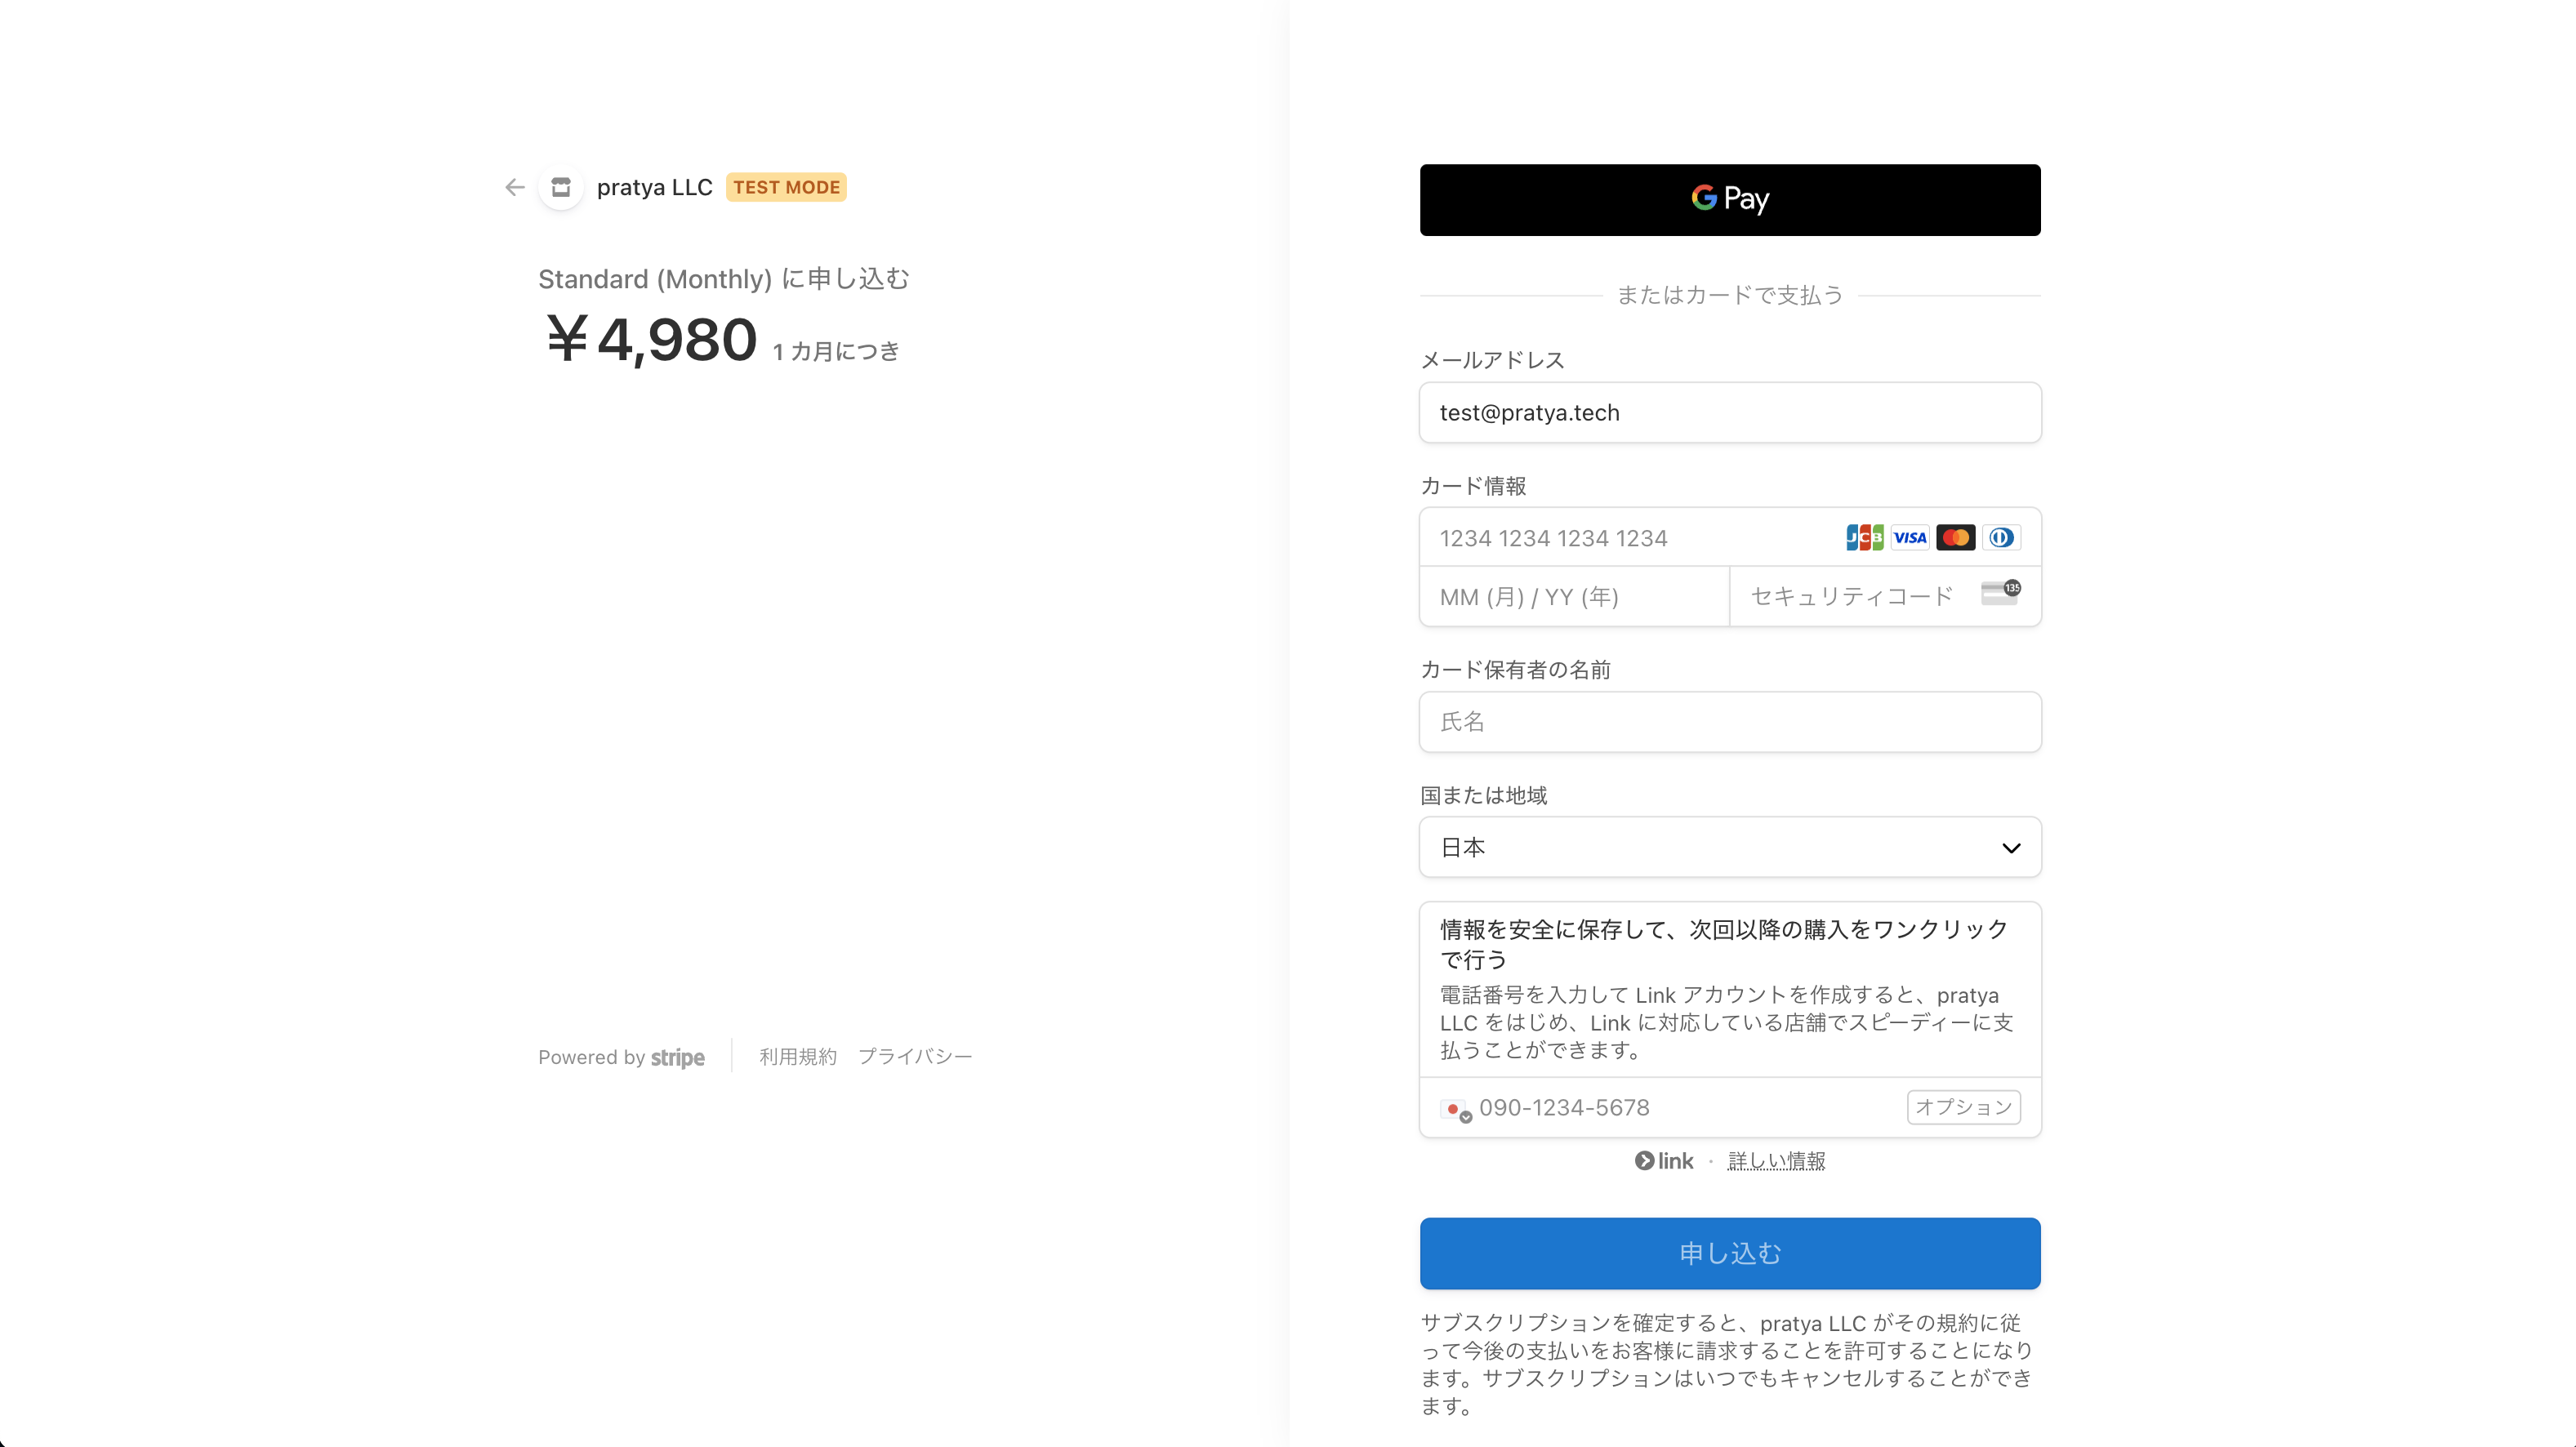
Select one of the plans and click "Start Using Plan"
For Light plan and above, you will be redirected to the Stripe payment screen. For the Free plan, you will skip the payment screen and proceed to the next model creation screen
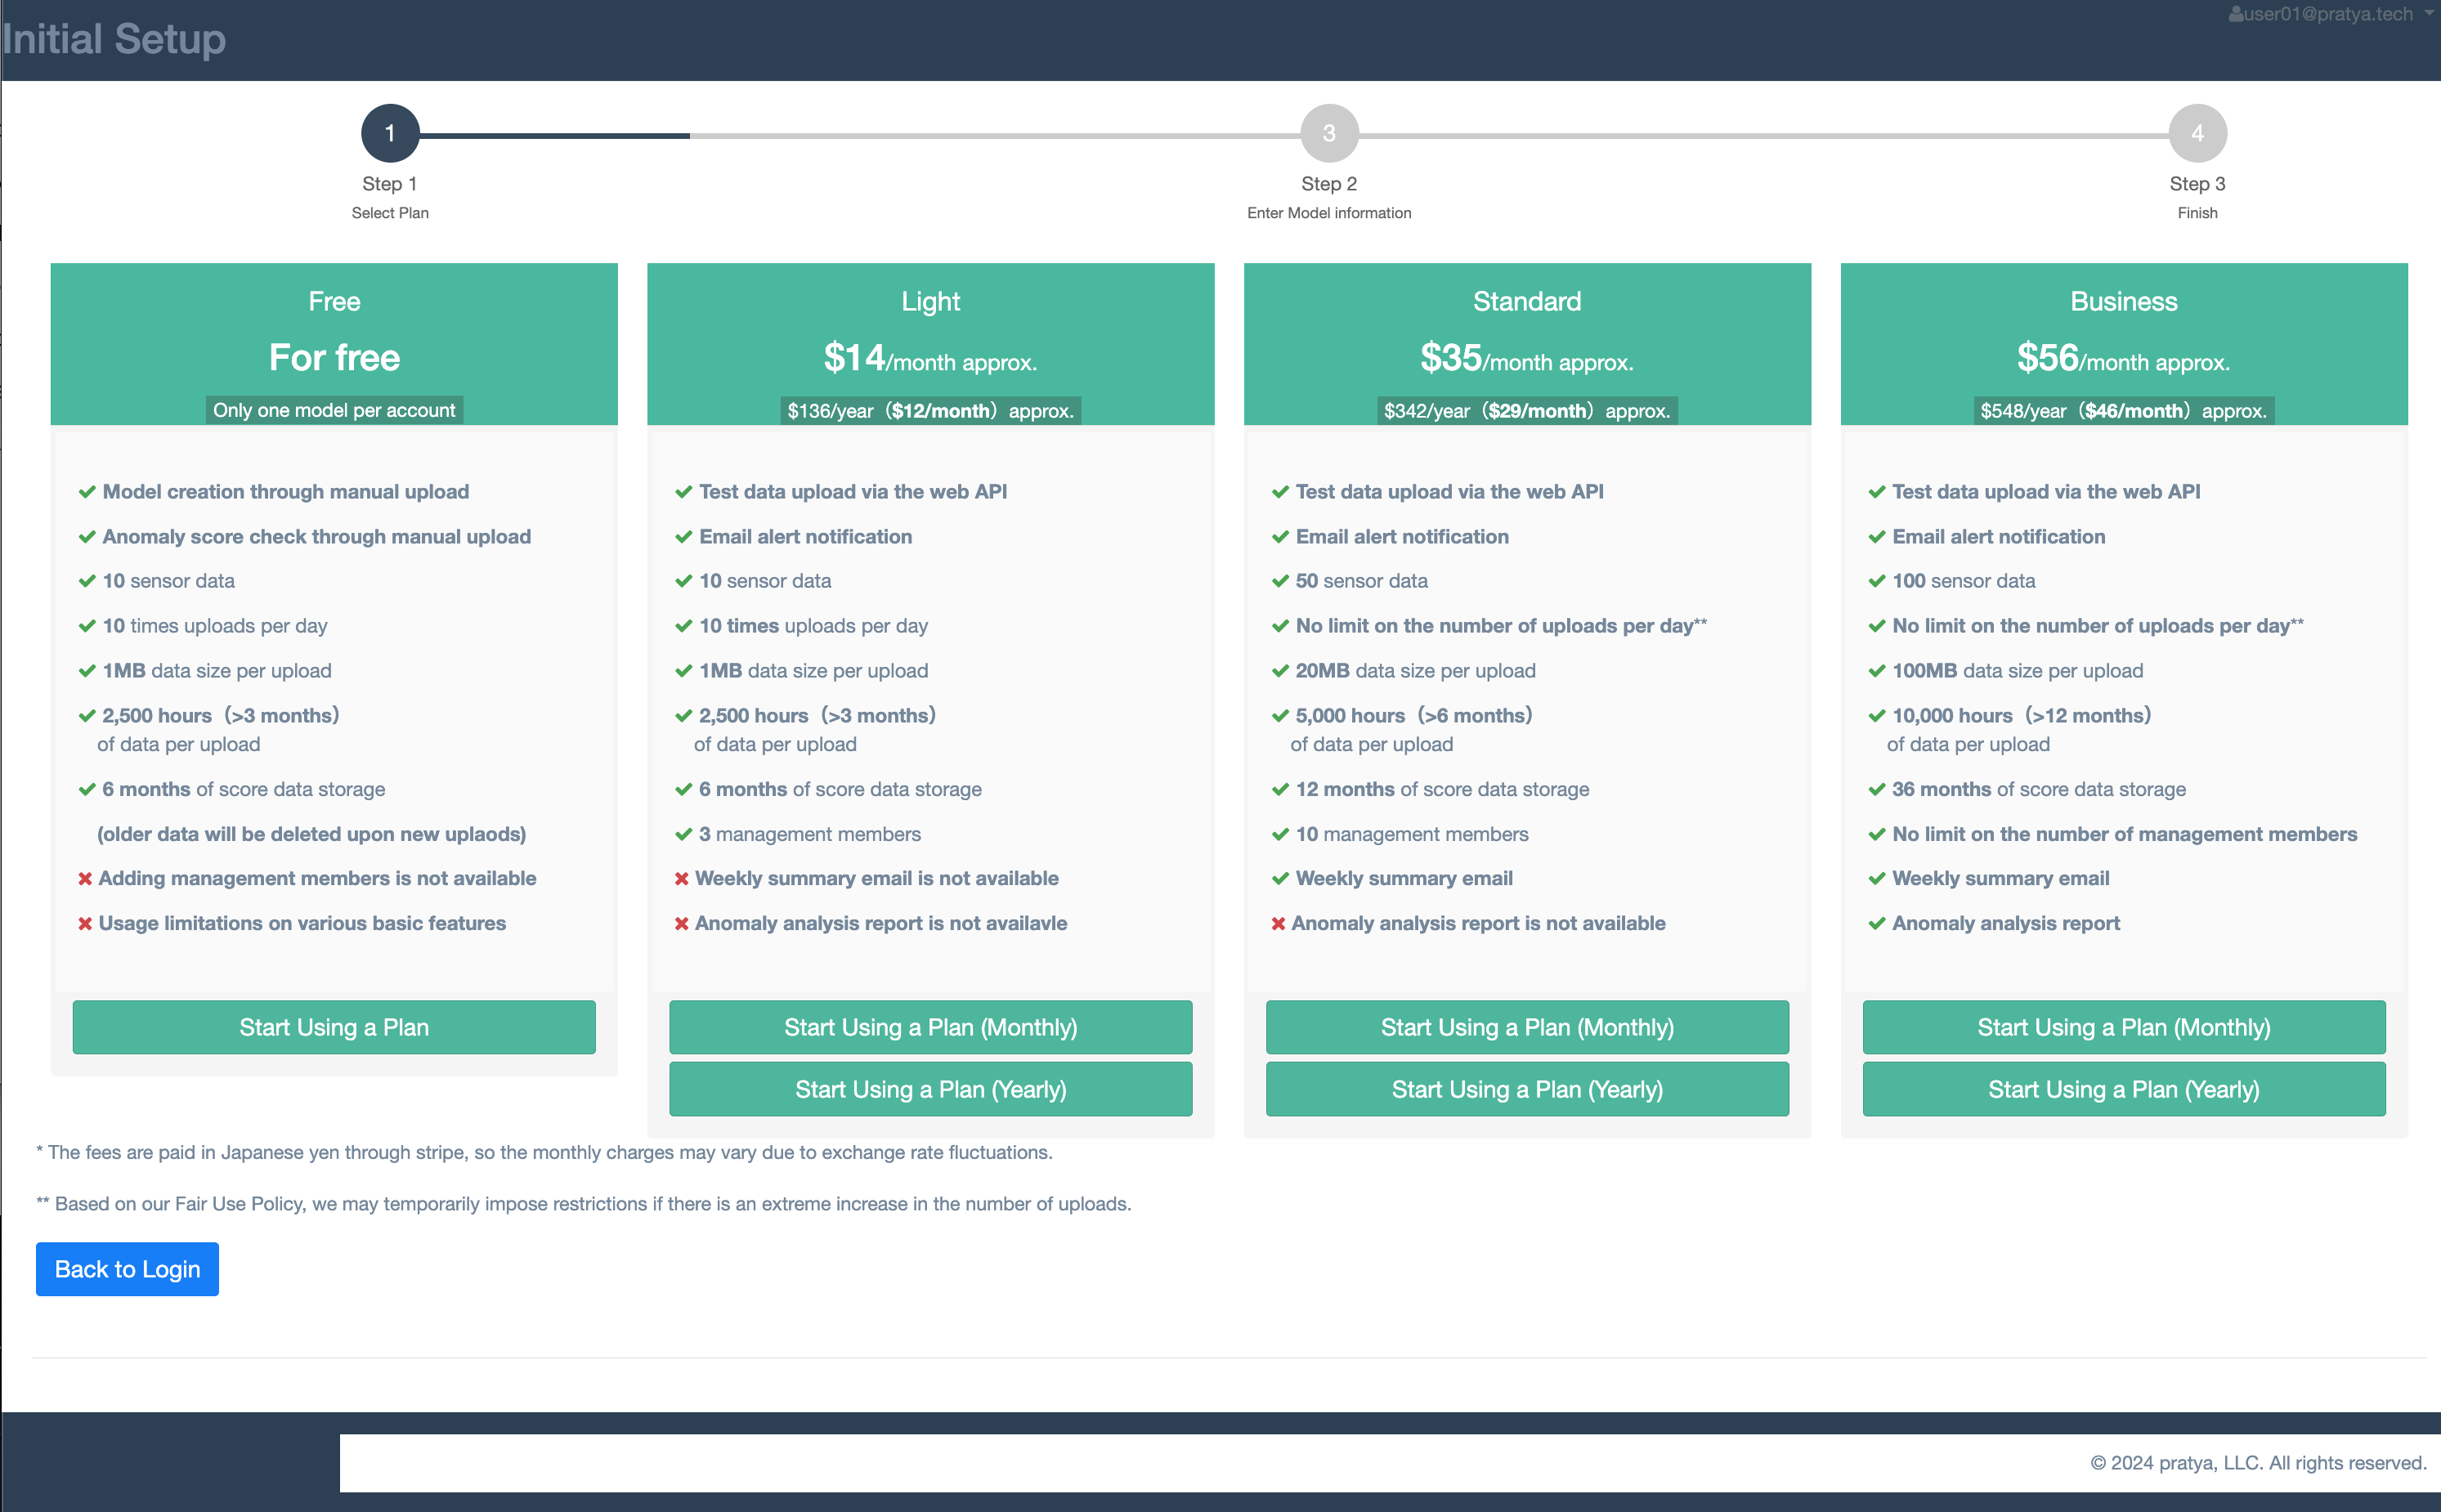
On the Stripe payment screen, enter your credit card information and click "Subscribe".
On the model creation screen, you will upload training data / test data to create an AI model and calculate scores
- Model name: The name of the model used in the service. We recommend using a name that identifies the target, such as the name of the monitoring equipment
-
CSV format: Select either "Wide format" where each row represents sensor values at each
timestamp, or "Long format" which has three columns: "timestamp", "sensor name", and
"sensor value".
For the long format, you need to specify which column corresponds to each of these
Sample of wide format CSV
Sample of long format CSV - Training data: Upload the training data used for model creation. Please use data from when the monitored equipment was operating normally
- Test data: Upload test data to calculate the model's score after creation. By using data that includes periods when the monitored equipment was abnormal, you can check if anomalies can be detected, but if you don't have data from abnormal times, you can also use the training data as test data to check the score during normal times
If you don't have sensor data on hand, click "Download Sample Data" to download sample data and use it as training data / test data
If you want to create a model later, click "Skip Model Creation" to complete the initial setup and move to the dashboard screen
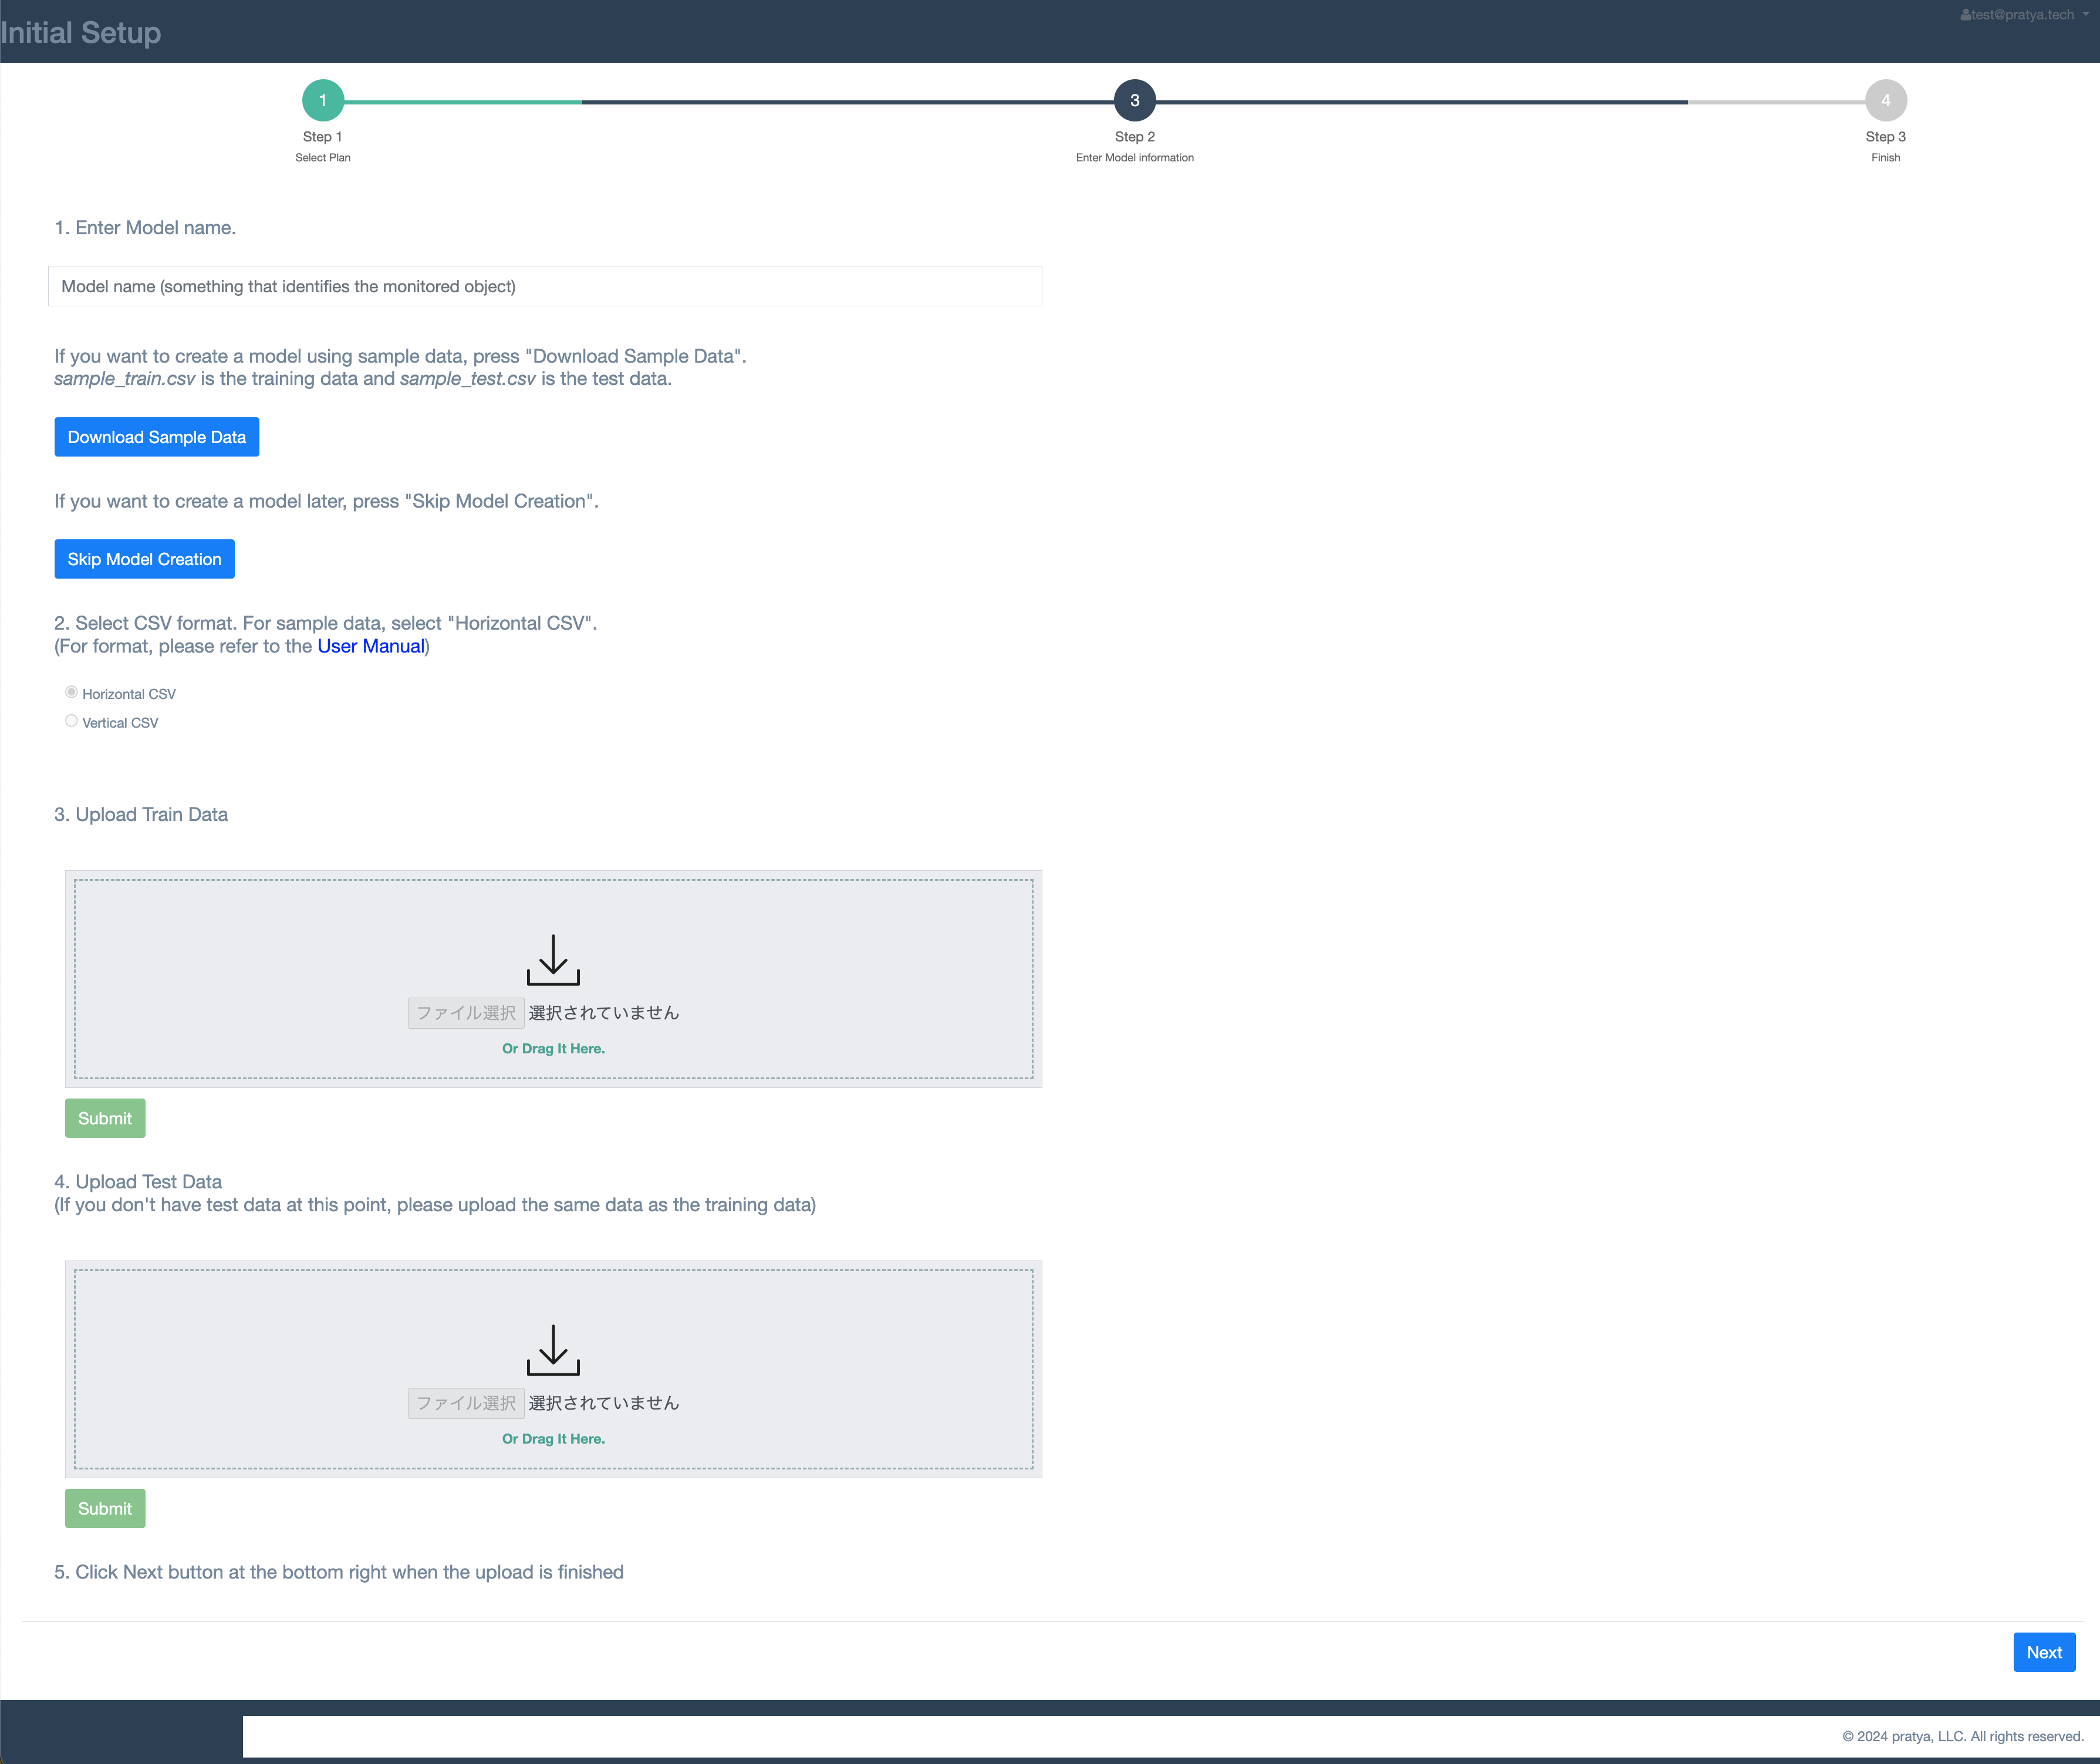
Once the model creation is complete, the initial setup is finished. Please proceed to the dashboard screen
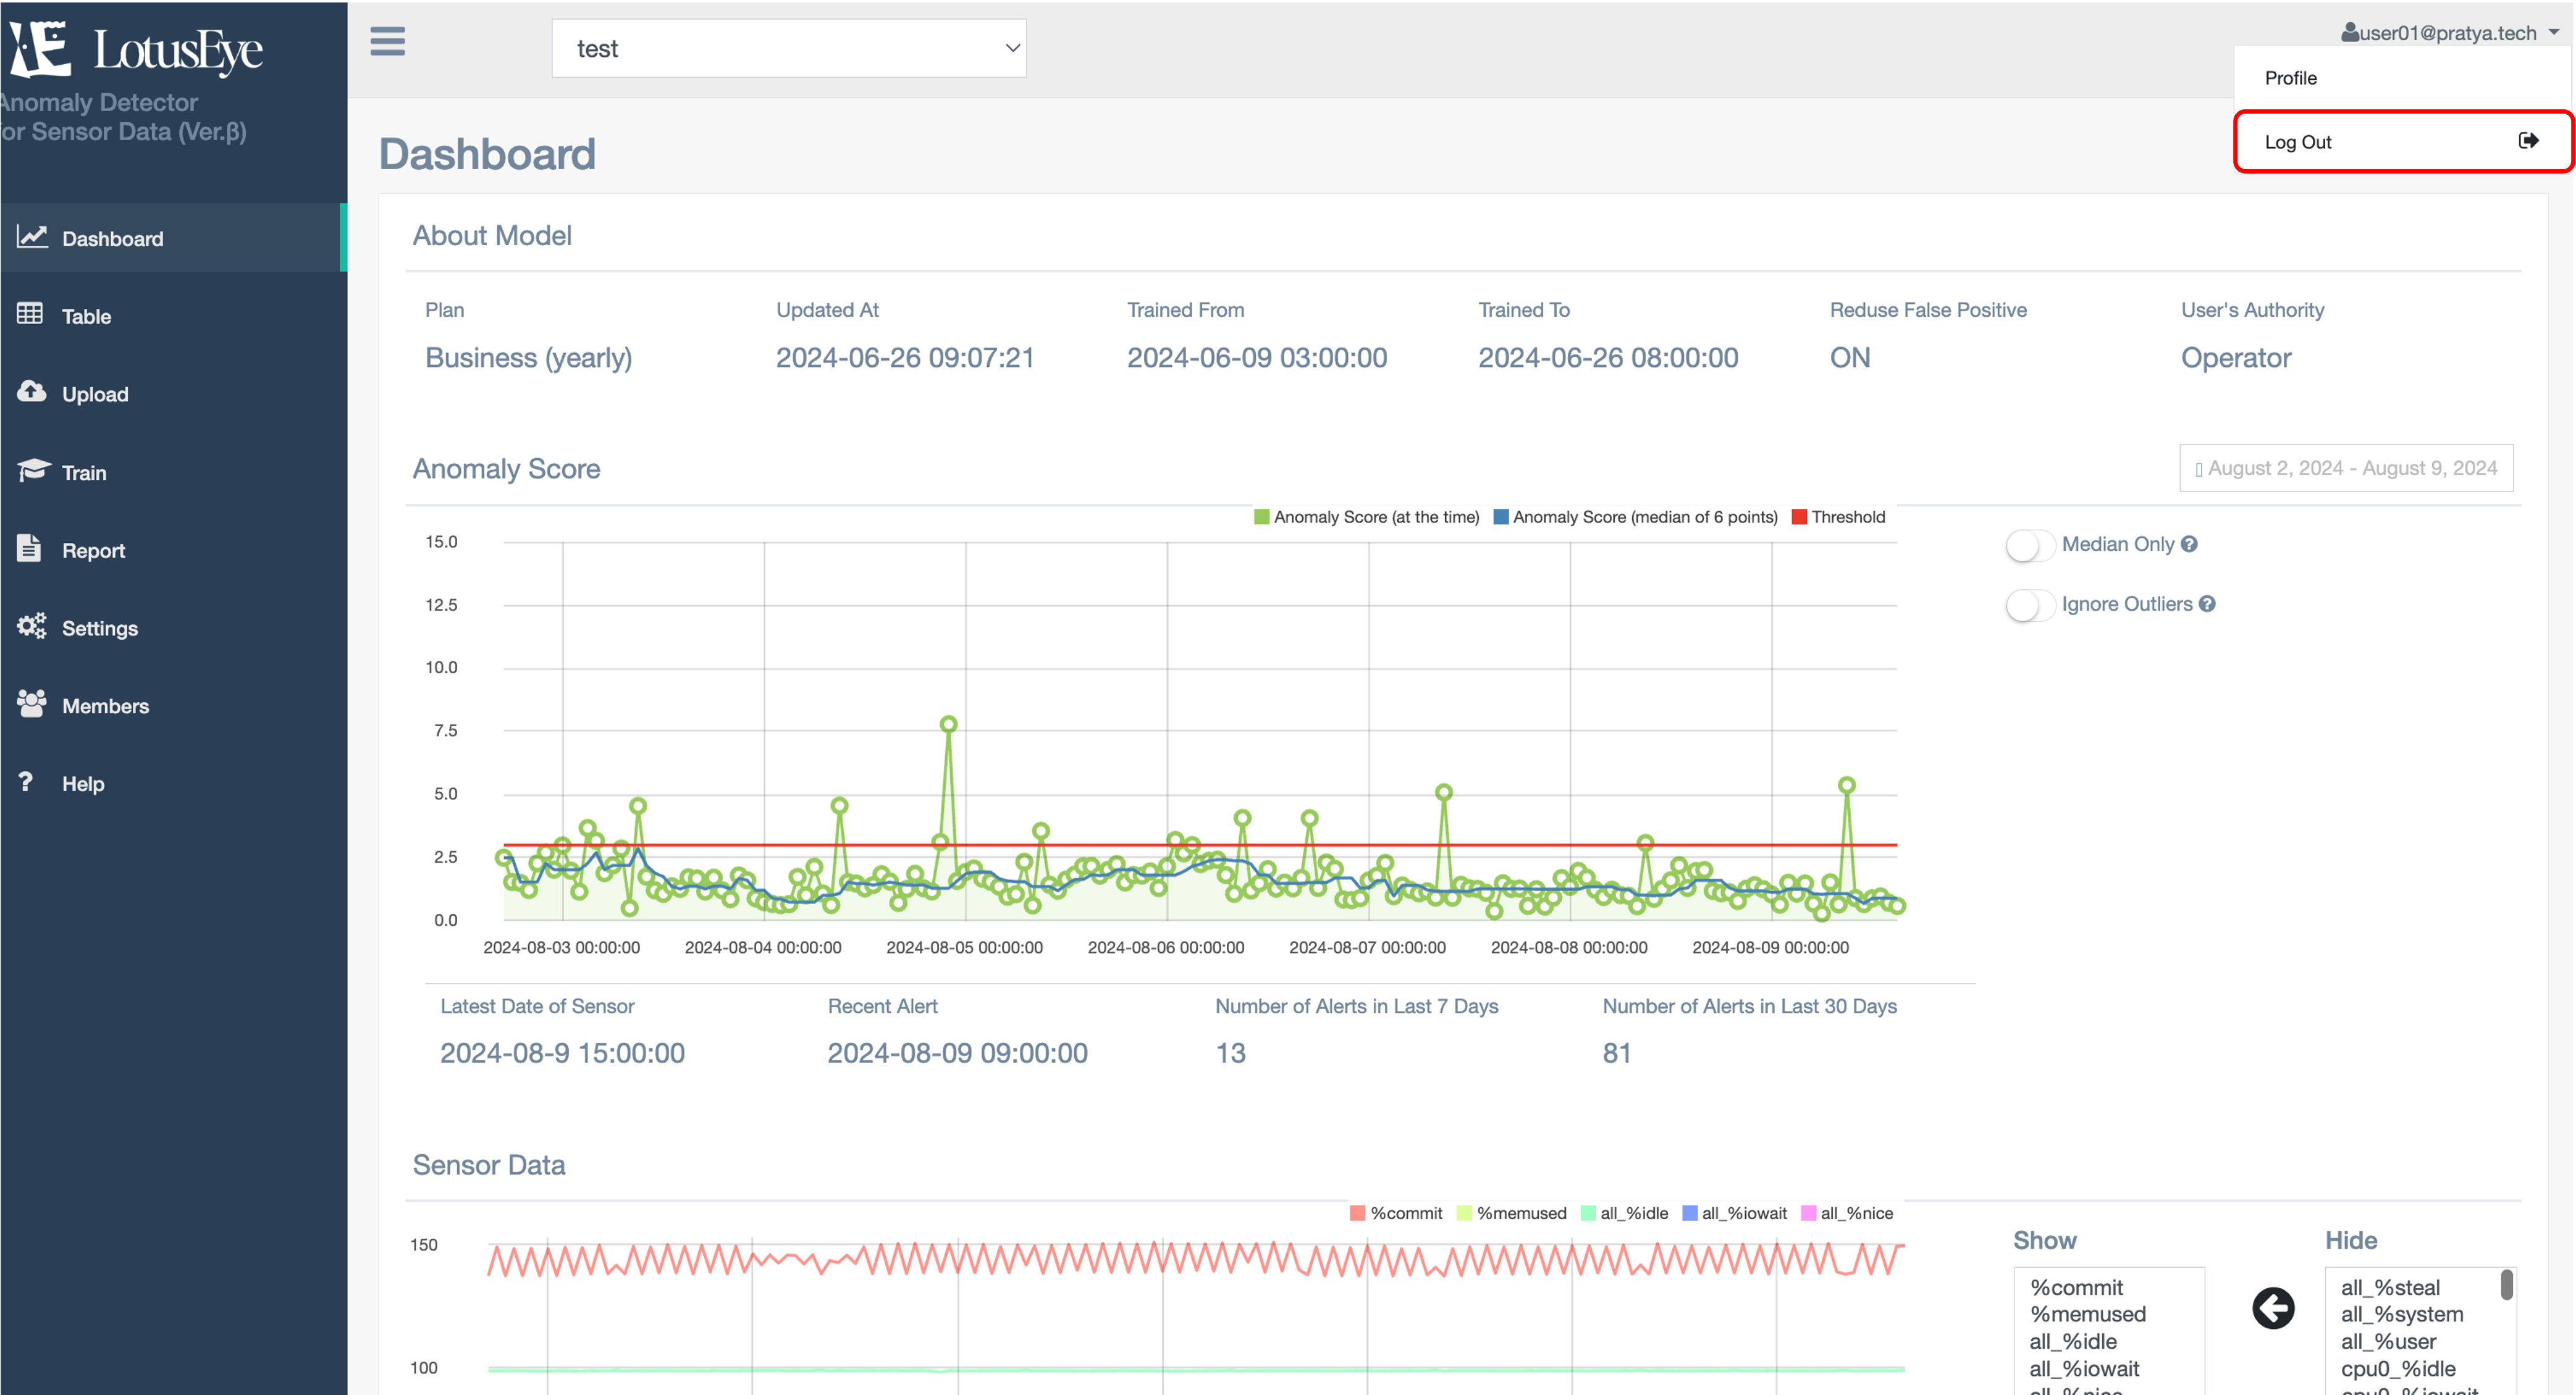
After logging in, the dashboard screen will be displayed.
- Side menu: Links to each screen are displayed. You can switch screens from the side menu
- Model selection box: If you have created multiple models, you can switch between models
- Profile settings: You can configure settings such as username and display language. For details, please refer to 5. Profile Settings
- Logout: Log out of the service
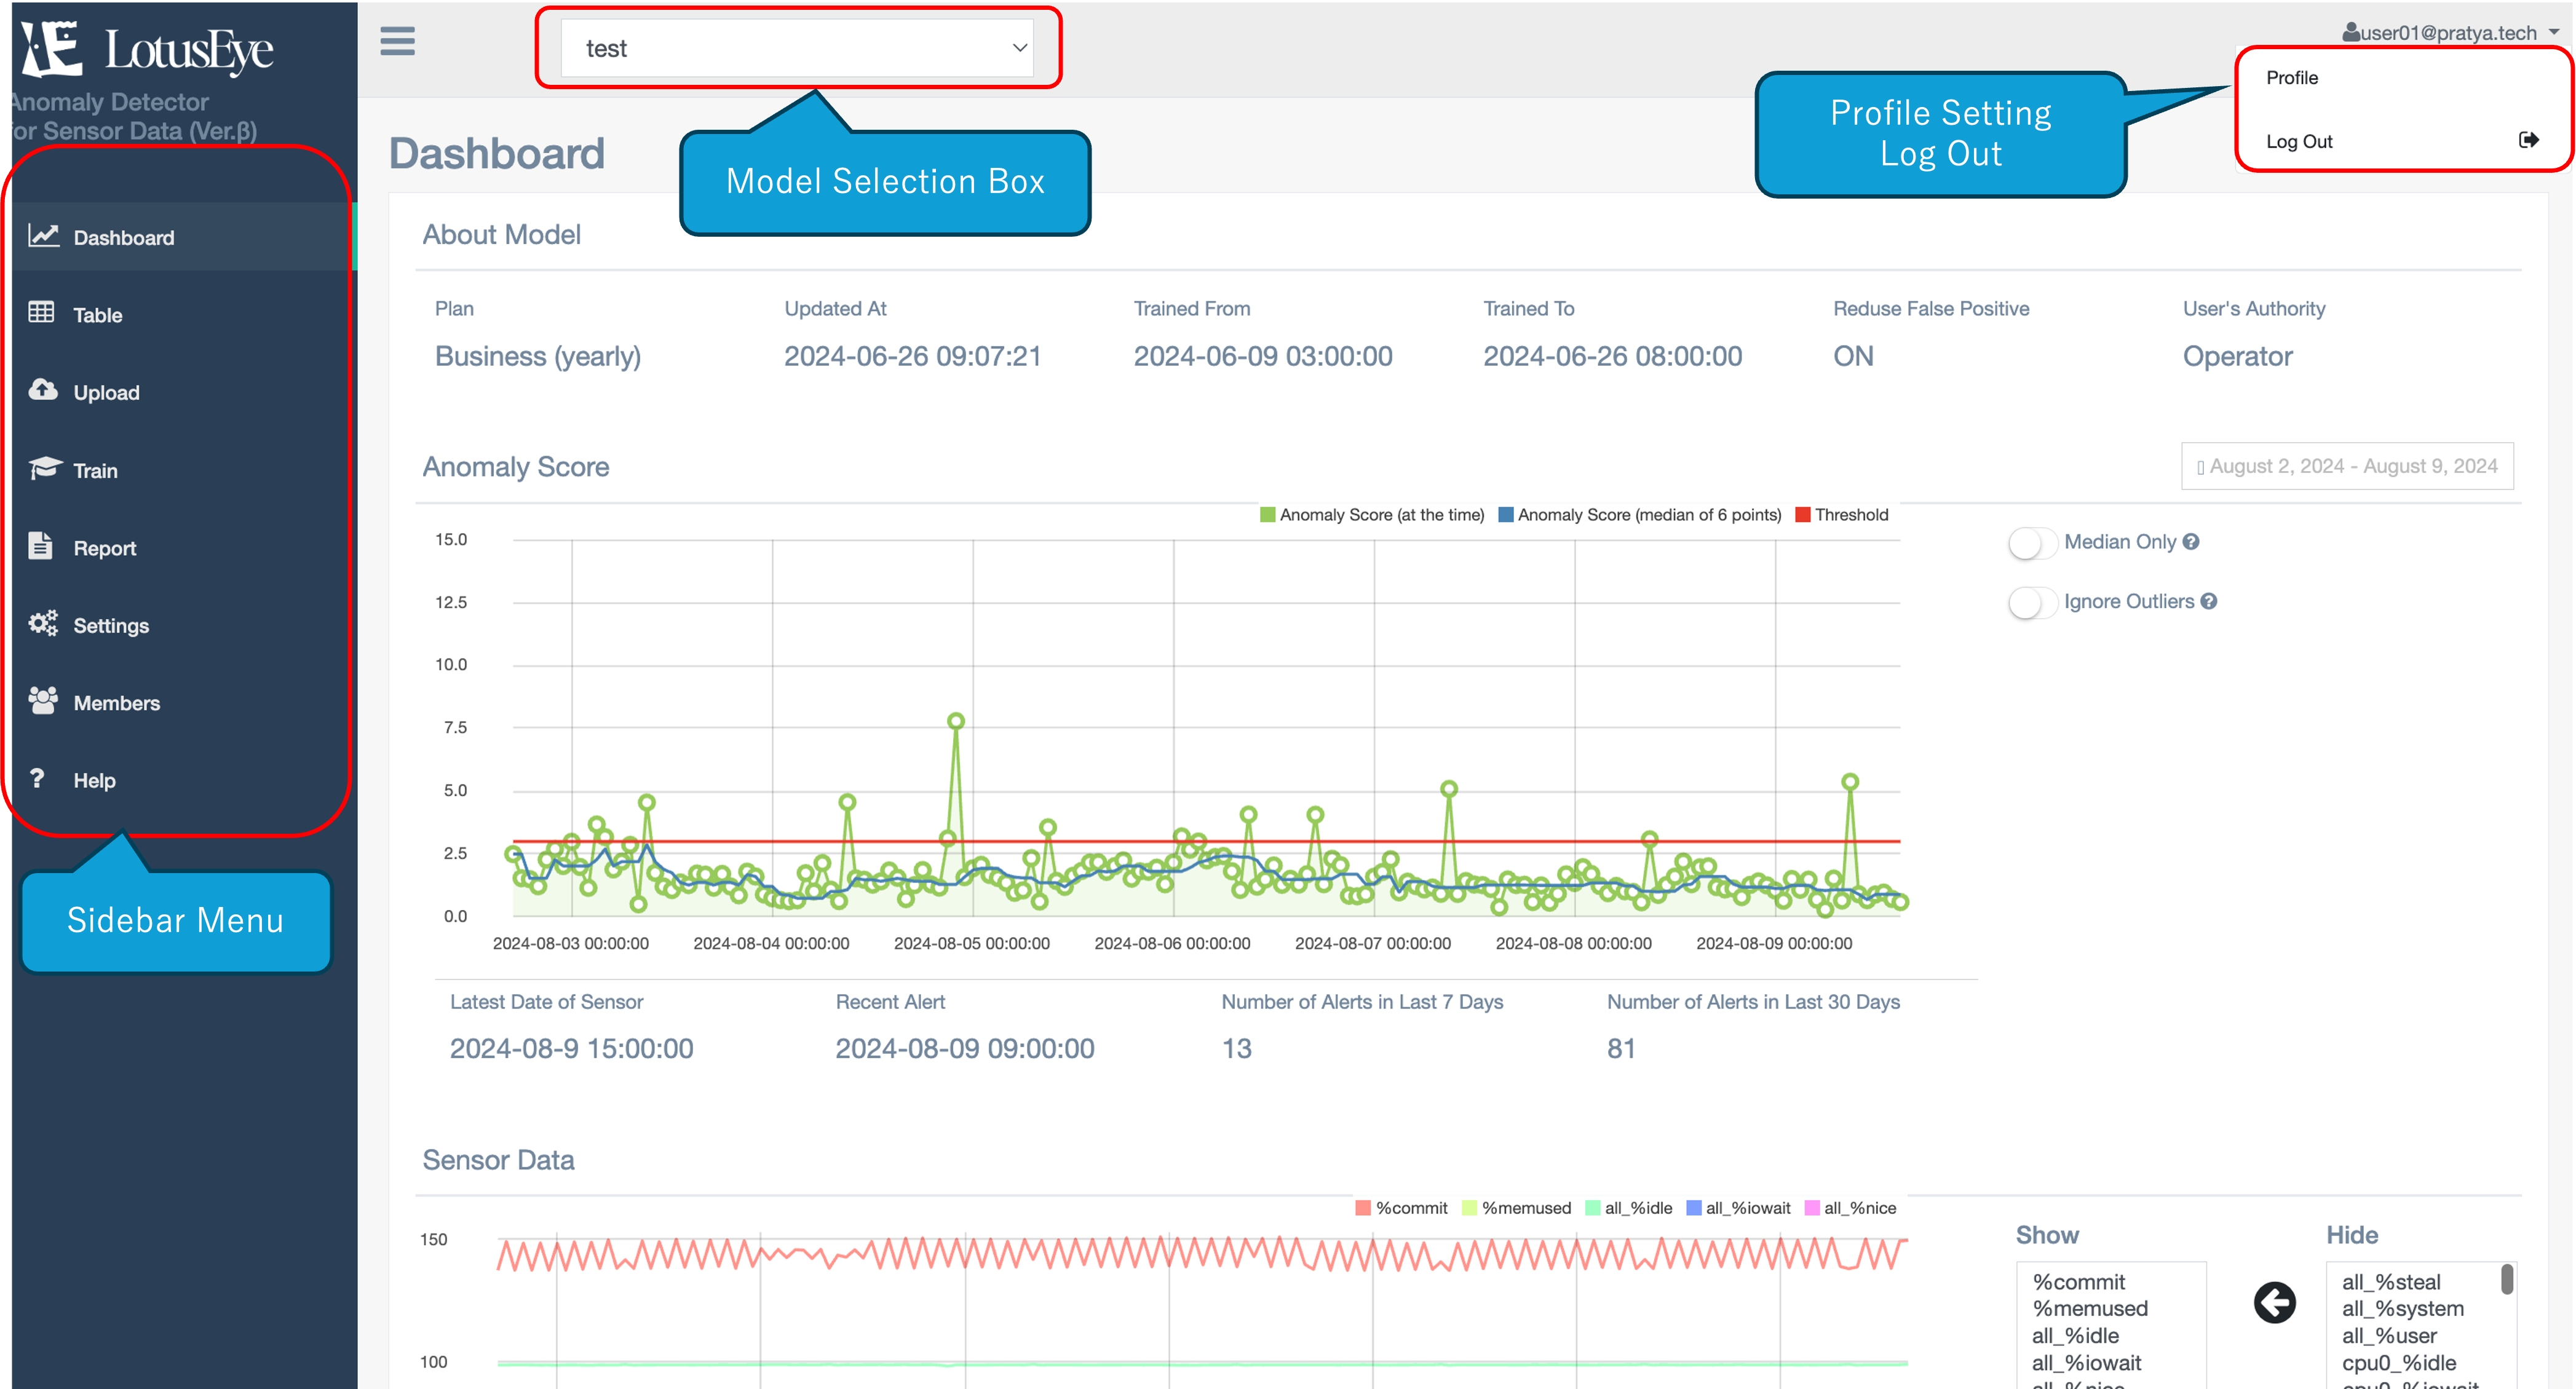
Below, we will explain the features available on each screen in the side menu
On the dashboard screen, you can check the model's scores and graphs of sensor values
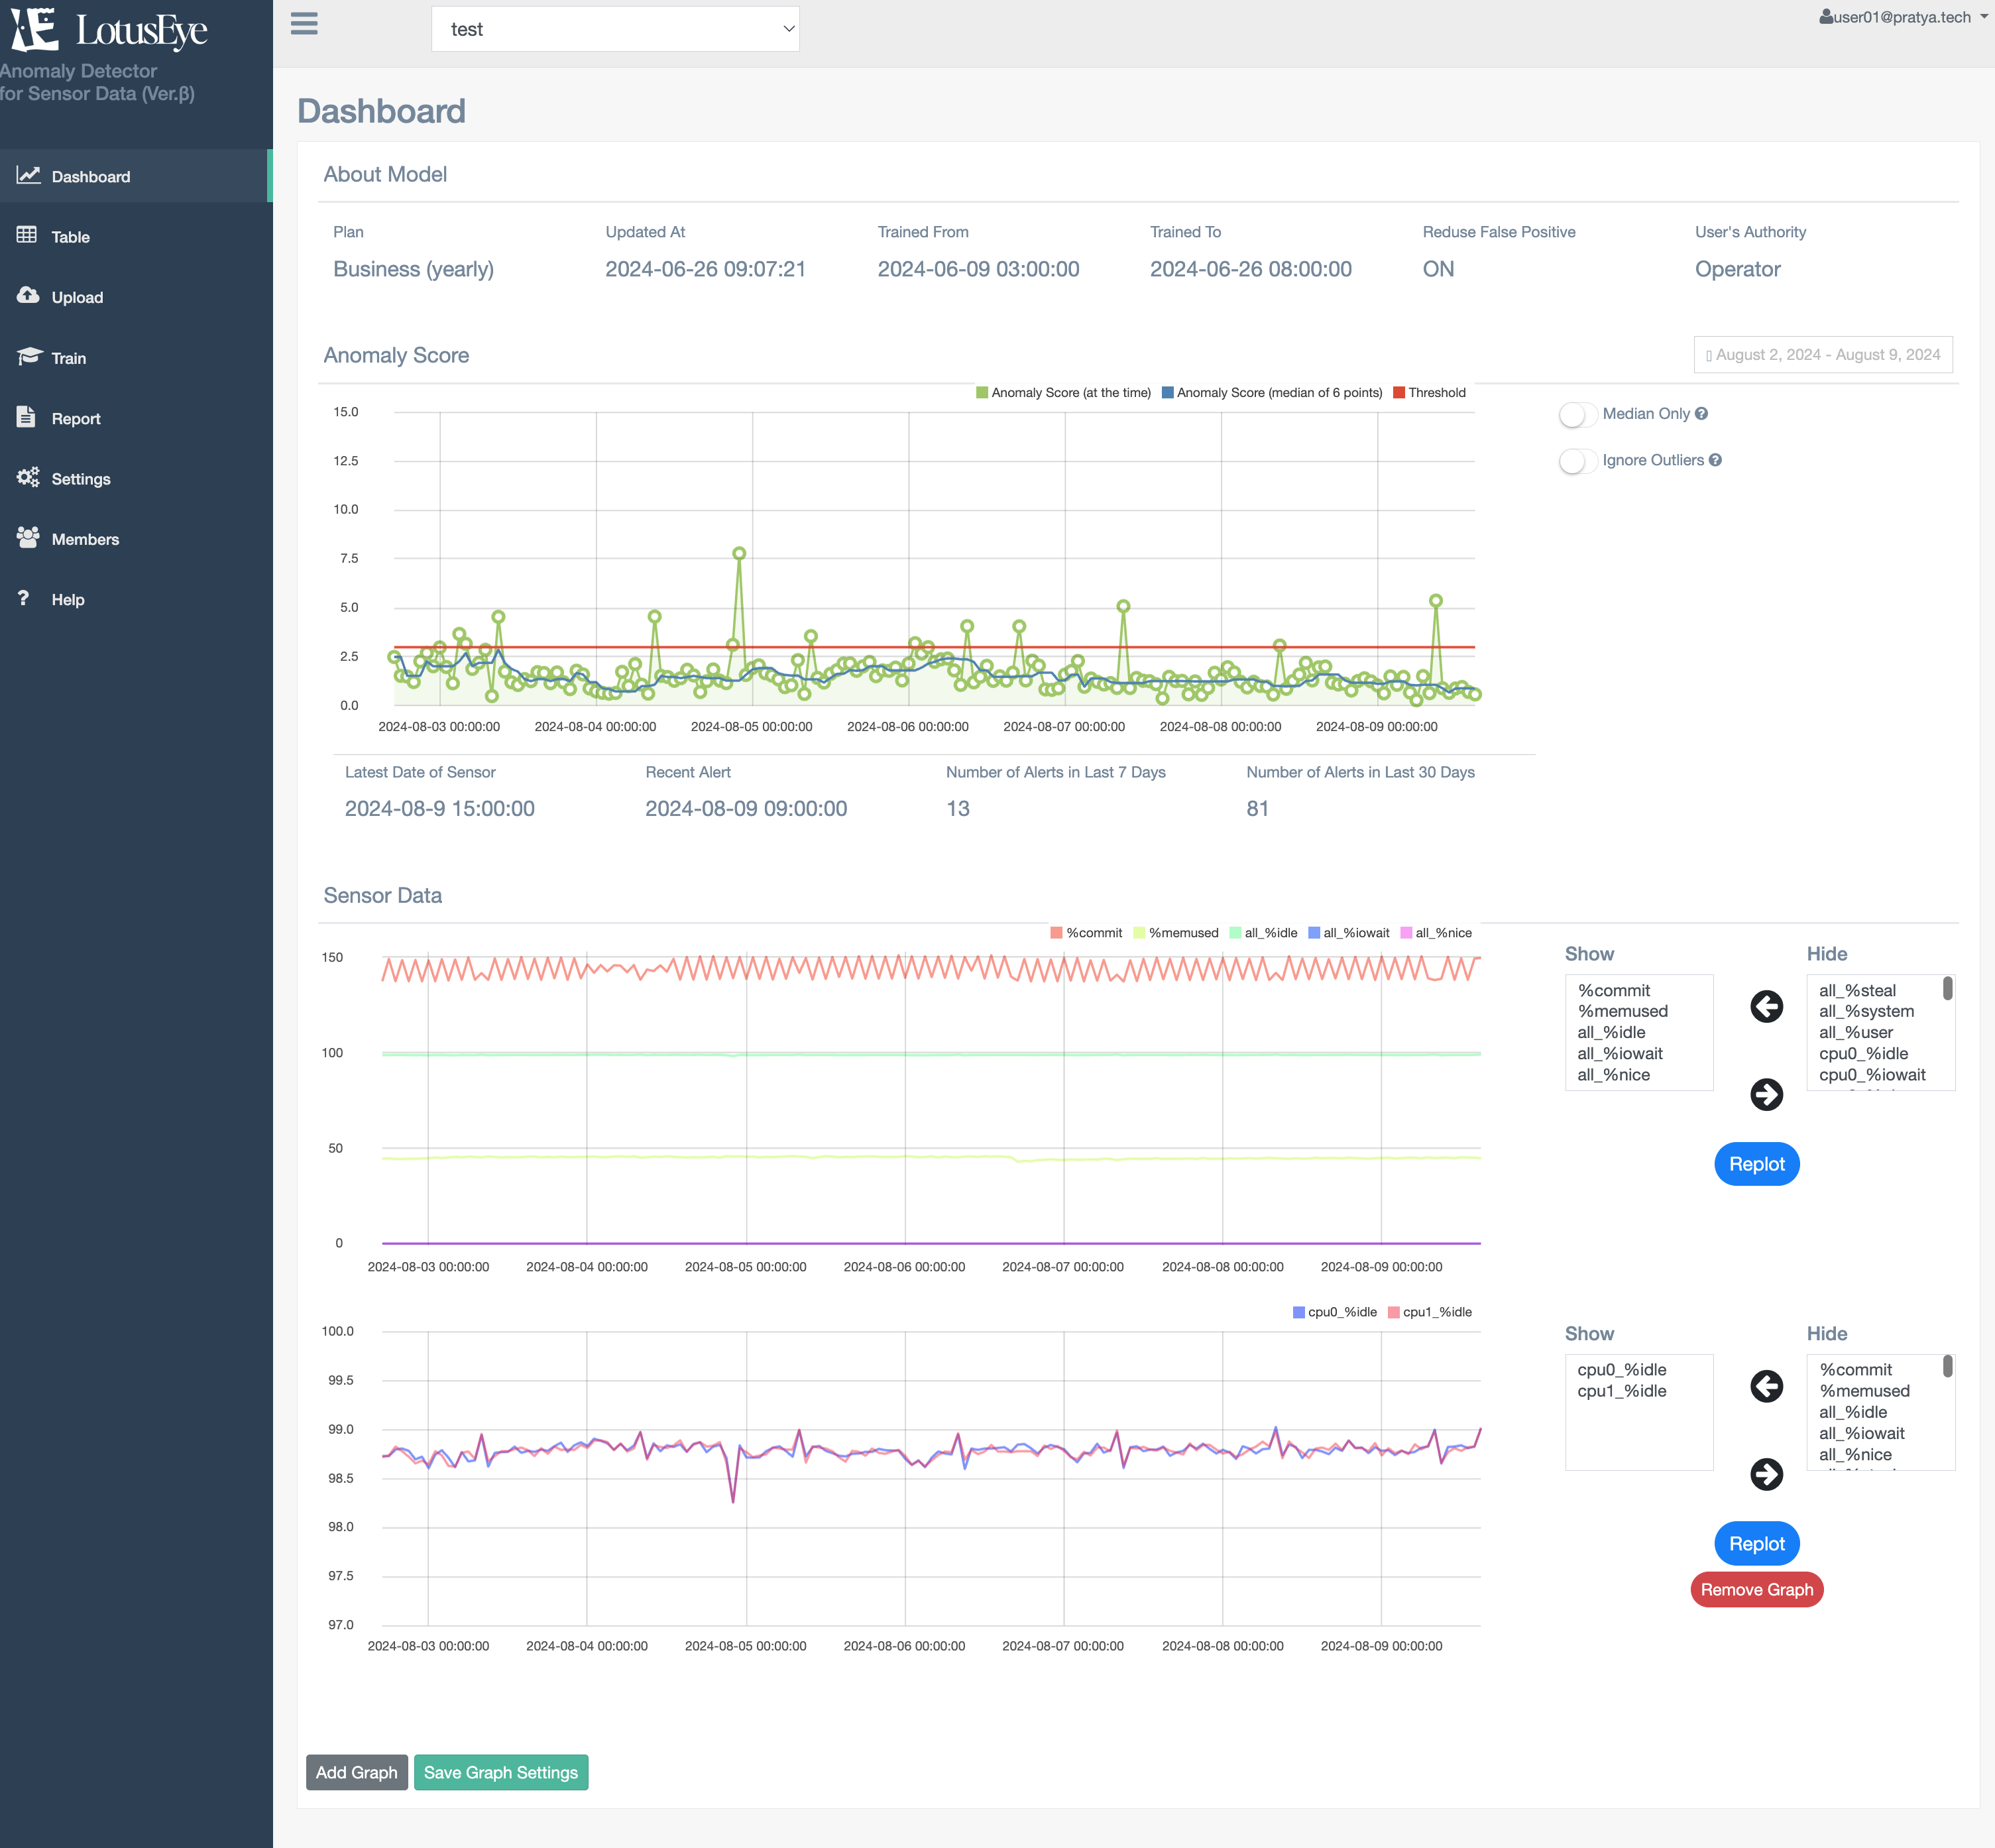
- Plan: You can check your current plan
- Model update date: You can check the date and time when the current model was created
- Training data start date: You can check the first timestamp of the training data
- Training data end date: You can check the last timestamp of the training data
- False positive reduction mode: You can check whether the mode to suppress false positives during normal times is being used (Refer to 3-4-4. False Positive Reduction Mode. Available for Light Plan and above)
- Logged-in user's permission: You can check the permissions that the logged-in user has for the model. The user who created the model is granted Owner permission. (Refer to 4. About User Permissions)
You can check the time series graph of the anomaly score.
- Anomaly Score (at the time): The anomaly score calculated at each time on the horizontal axis. Displayed as a green line
- Anomaly Score (median of 6 points): The median of the anomaly scores from the past 6 time points. Displayed as a blue line
- Threshold: The threshold for the anomaly score. Displayed as a red line (The default value for the threshold is 3. The value can be changed from the 3-6. Settings screen)
-
Display period selection (box in the upper right): You can select the display
period for the graph (this also applies to the sensor data graph mentioned
later)
- Today: Displays the graph for the current day
- Yesterday: Displays the graph for the previous day
- Last 7 Days: Displays the graph for the past 7 days
- Last 30 Days: Displays the graph for the past 30 days
- Last 3 Months: Displays the graph for the past 3 months
- Last 1 Year: Displays the graph for the past year
- Custom: You can specify the display period using a calendar
- Show median only: Only the Anomaly Score (median of 6 points) is displayed. This makes it easier to see changes in the anomaly score when there is a lot of noise or momentary score increases
- Ignore outliers: Expands the display range of the graph by ignoring temporary high scores.
You can check the anomaly score at that time by hovering your mouse over the graph. Also, by clicking, you can register comments on the score. By recording the situation when the score rises or the cause of anomalies, you can review them later
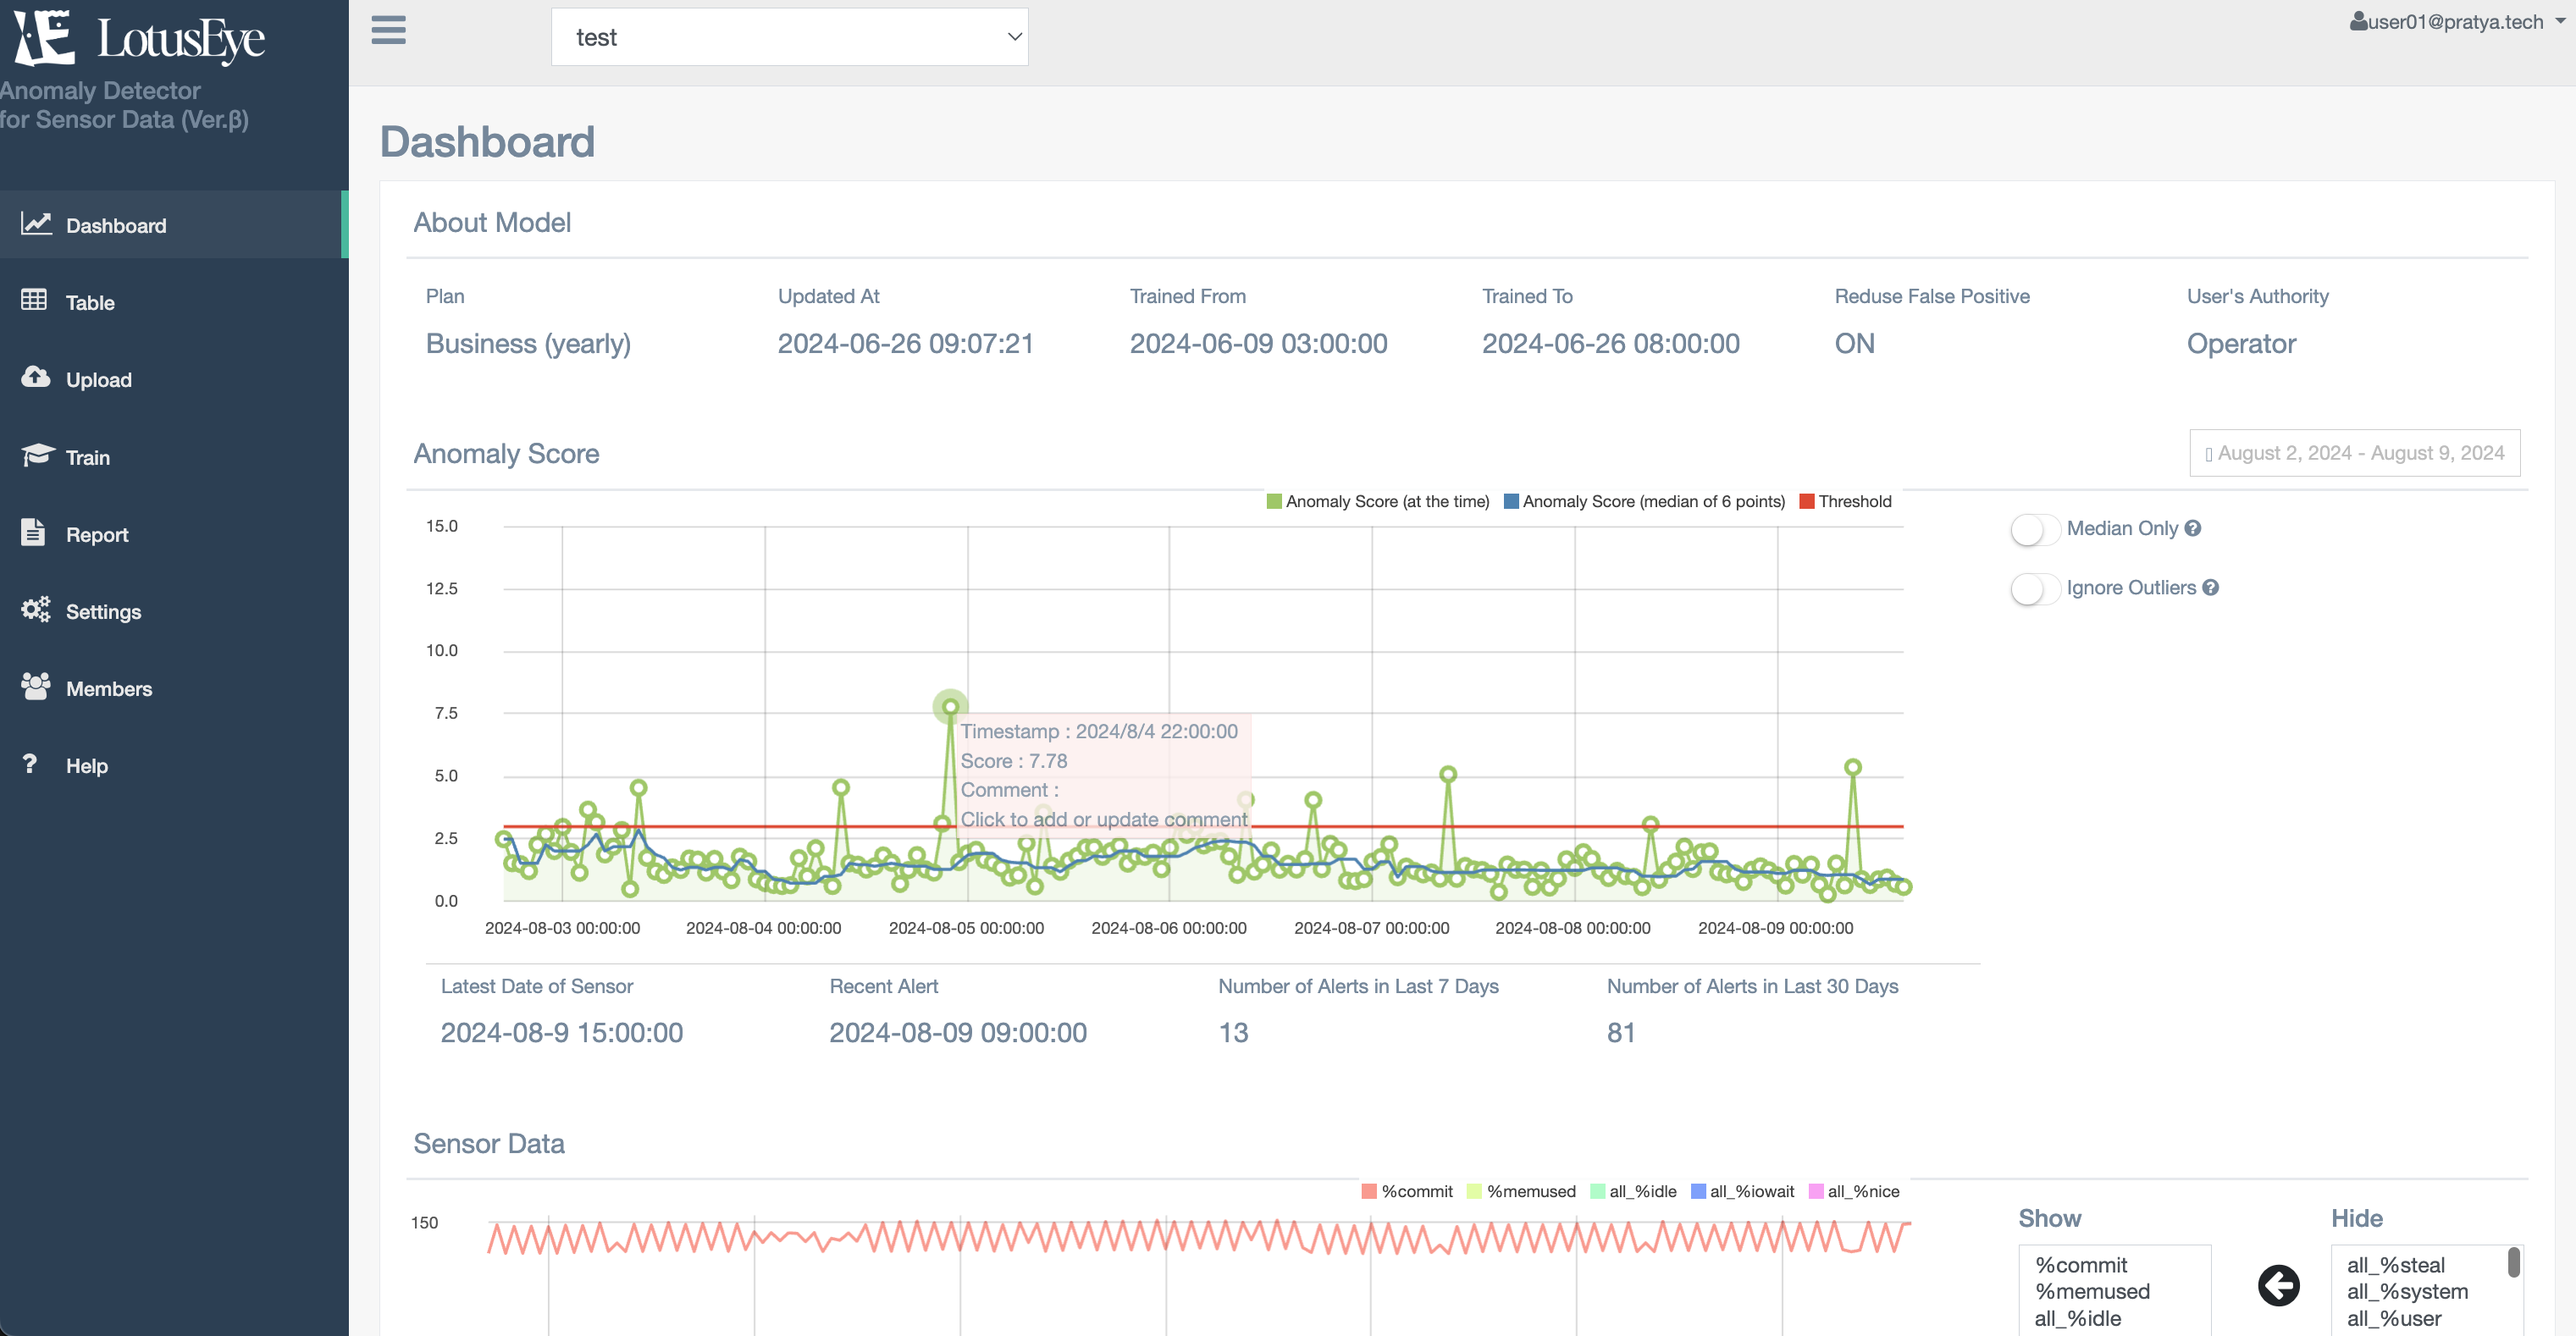
You can check the time series graph of each sensor value in the uploaded test data
- Display: This is the list of sensors displayed on the graph. You can switch hidden sensors to display by selecting the sensor on the hidden box and pressing the left arrow button
- Hidden: This is the list of sensors not displayed on the graph. You can switch displayed sensors to hidden by selecting the sensor on the display box and pressing the right arrow button
- Refresh: If you change the displayed/hidden sensors, you can update the graph by pressing the refresh button
- Add Graph: You can add graphs to display. When sensors with different value ranges are mixed, you can improve the visibility of the graphs by separating the display ranges into multiple graphs
- Delete Graph: You can delete added graphs. The default displayed graph cannot be deleted
- Save Graph Settings: You can save the settings for displayed/hidden sensors and added graphs. You can display the graph with the same settings next time. If you don't save the settings, they will be reset when you leave the page
On the data screen, you can check the uploaded test data in table format. In addition to sensor values, the table also displays the anomaly score (Anomaly Score), comments (Comment), and comment registrant (Commented by). Timestamps are displayed in hourly units, so if the uploaded data is not in hourly units, the sensor values displayed will be rounded to hourly averages.
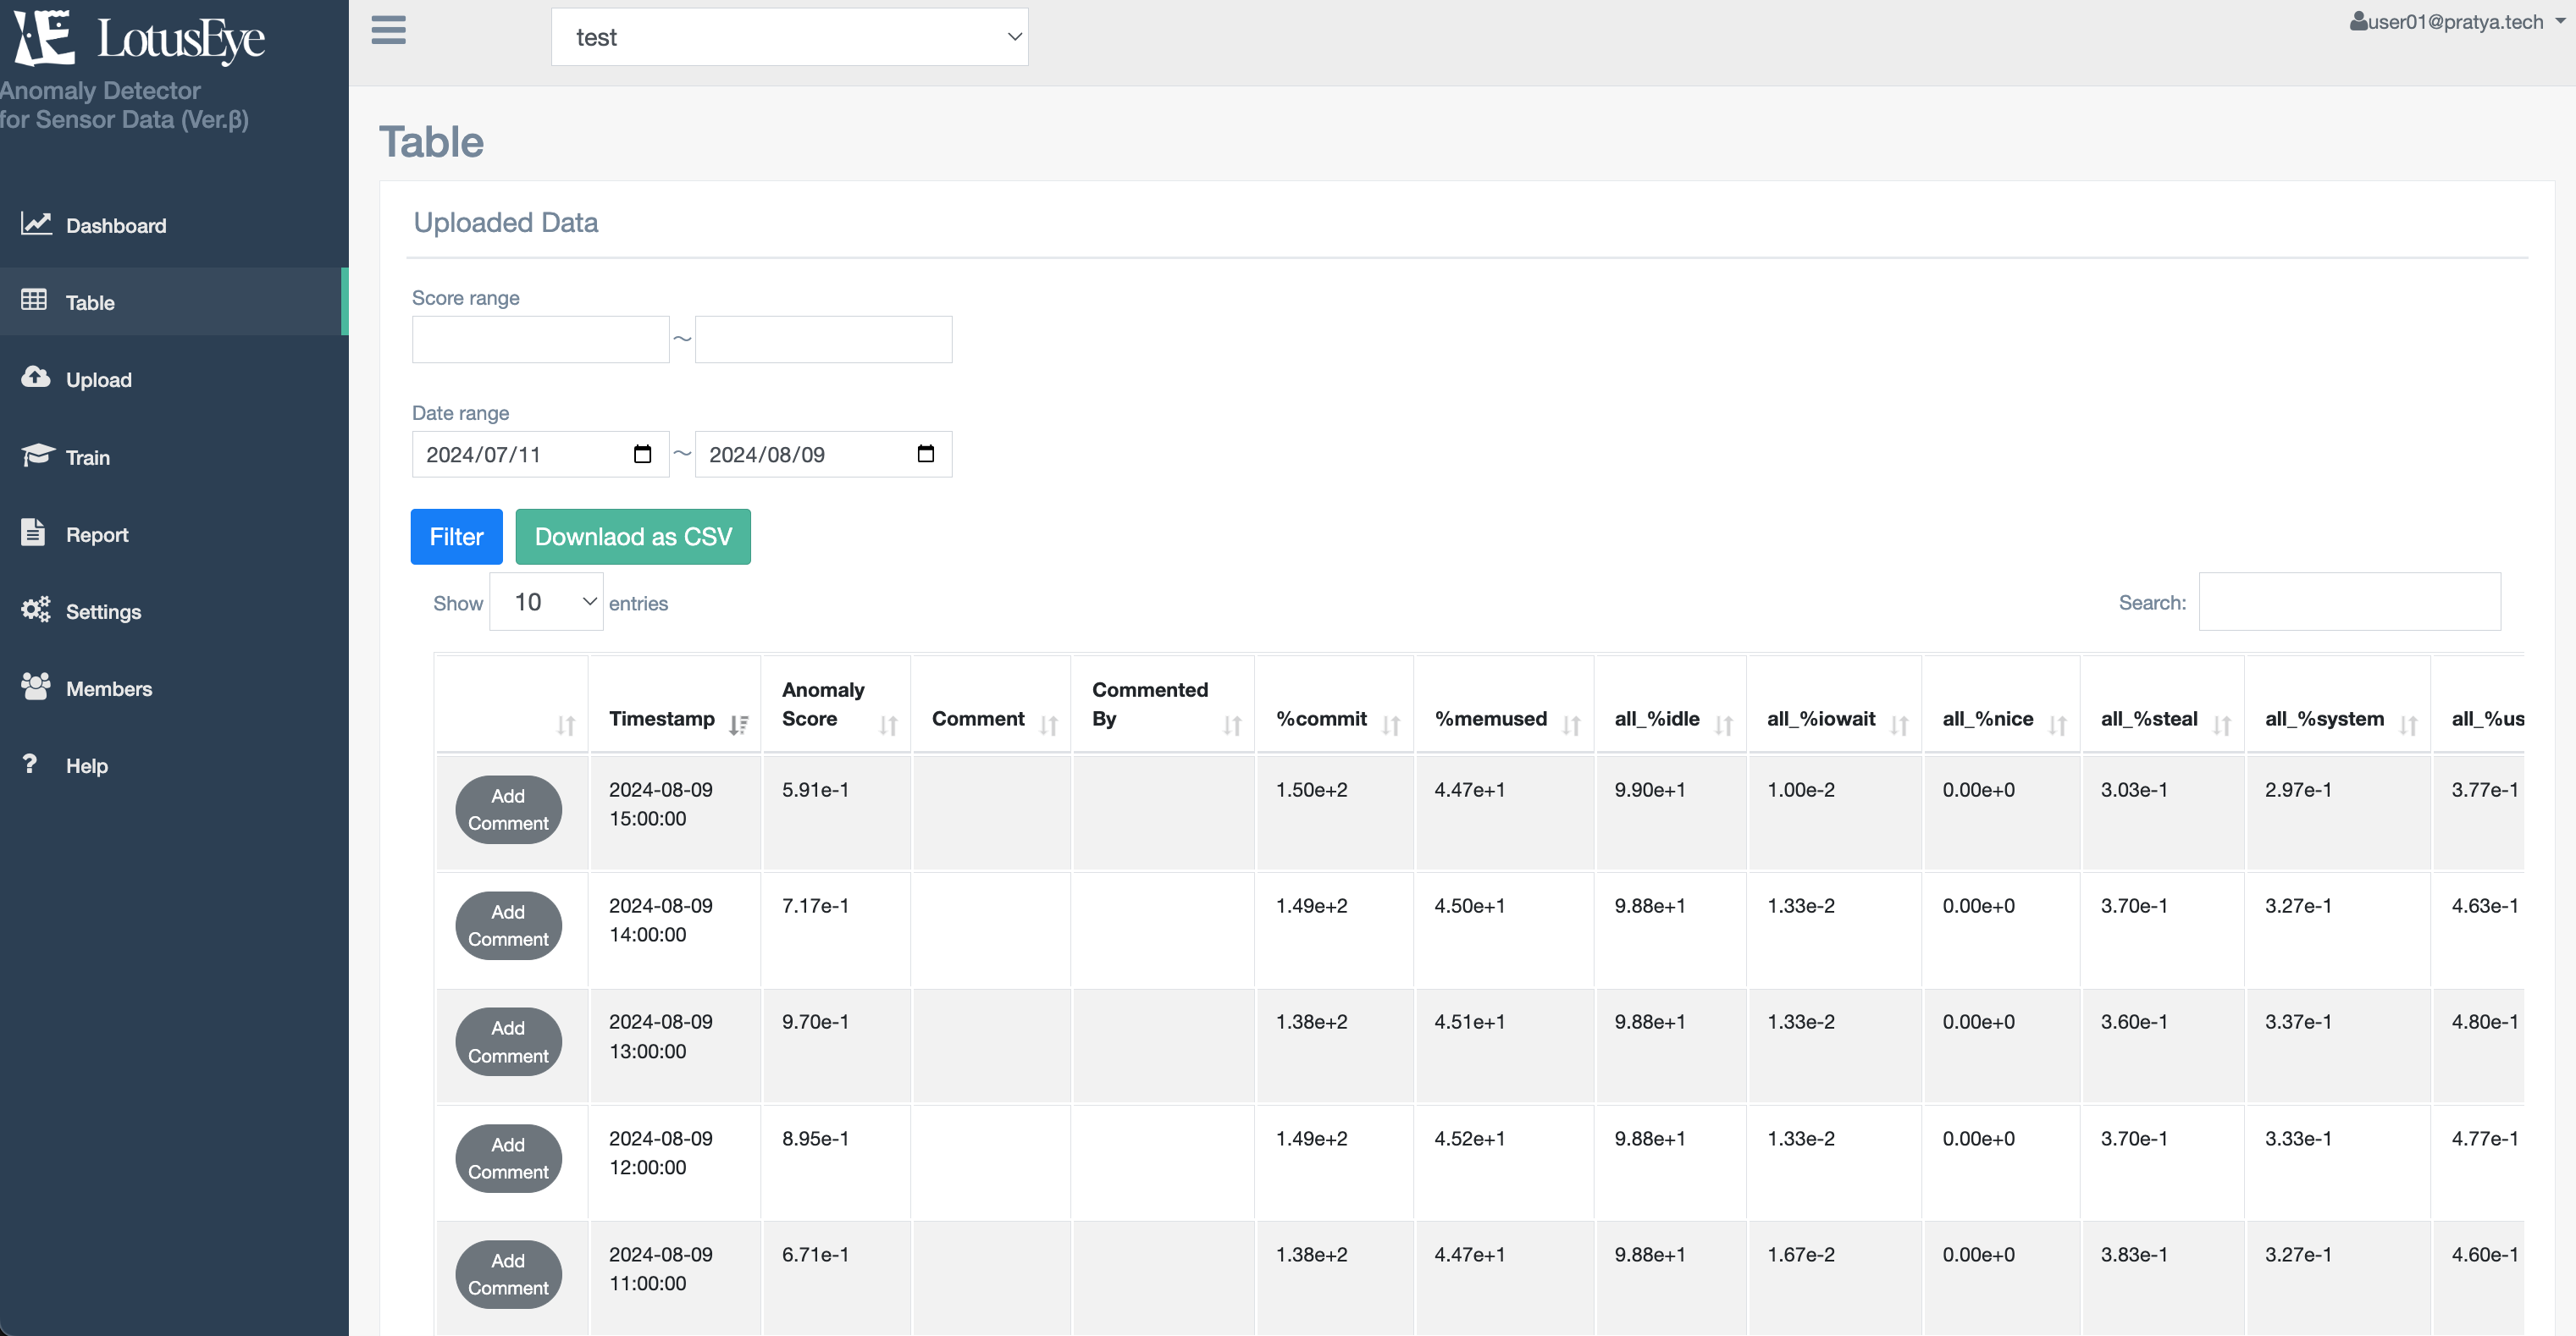
- Anomaly score range: Filter the data to display by anomaly score
- Date range: Filter the data to display by date
- Filter: After specifying the anomaly score range and date range, you can filter the data by clicking this button
- Download as CSV: Download the data in the specified range in CSV format
- Add Comment: You can register comments on scores, similar to the dashboard screen
- Search: You can search for comments or comment registrants
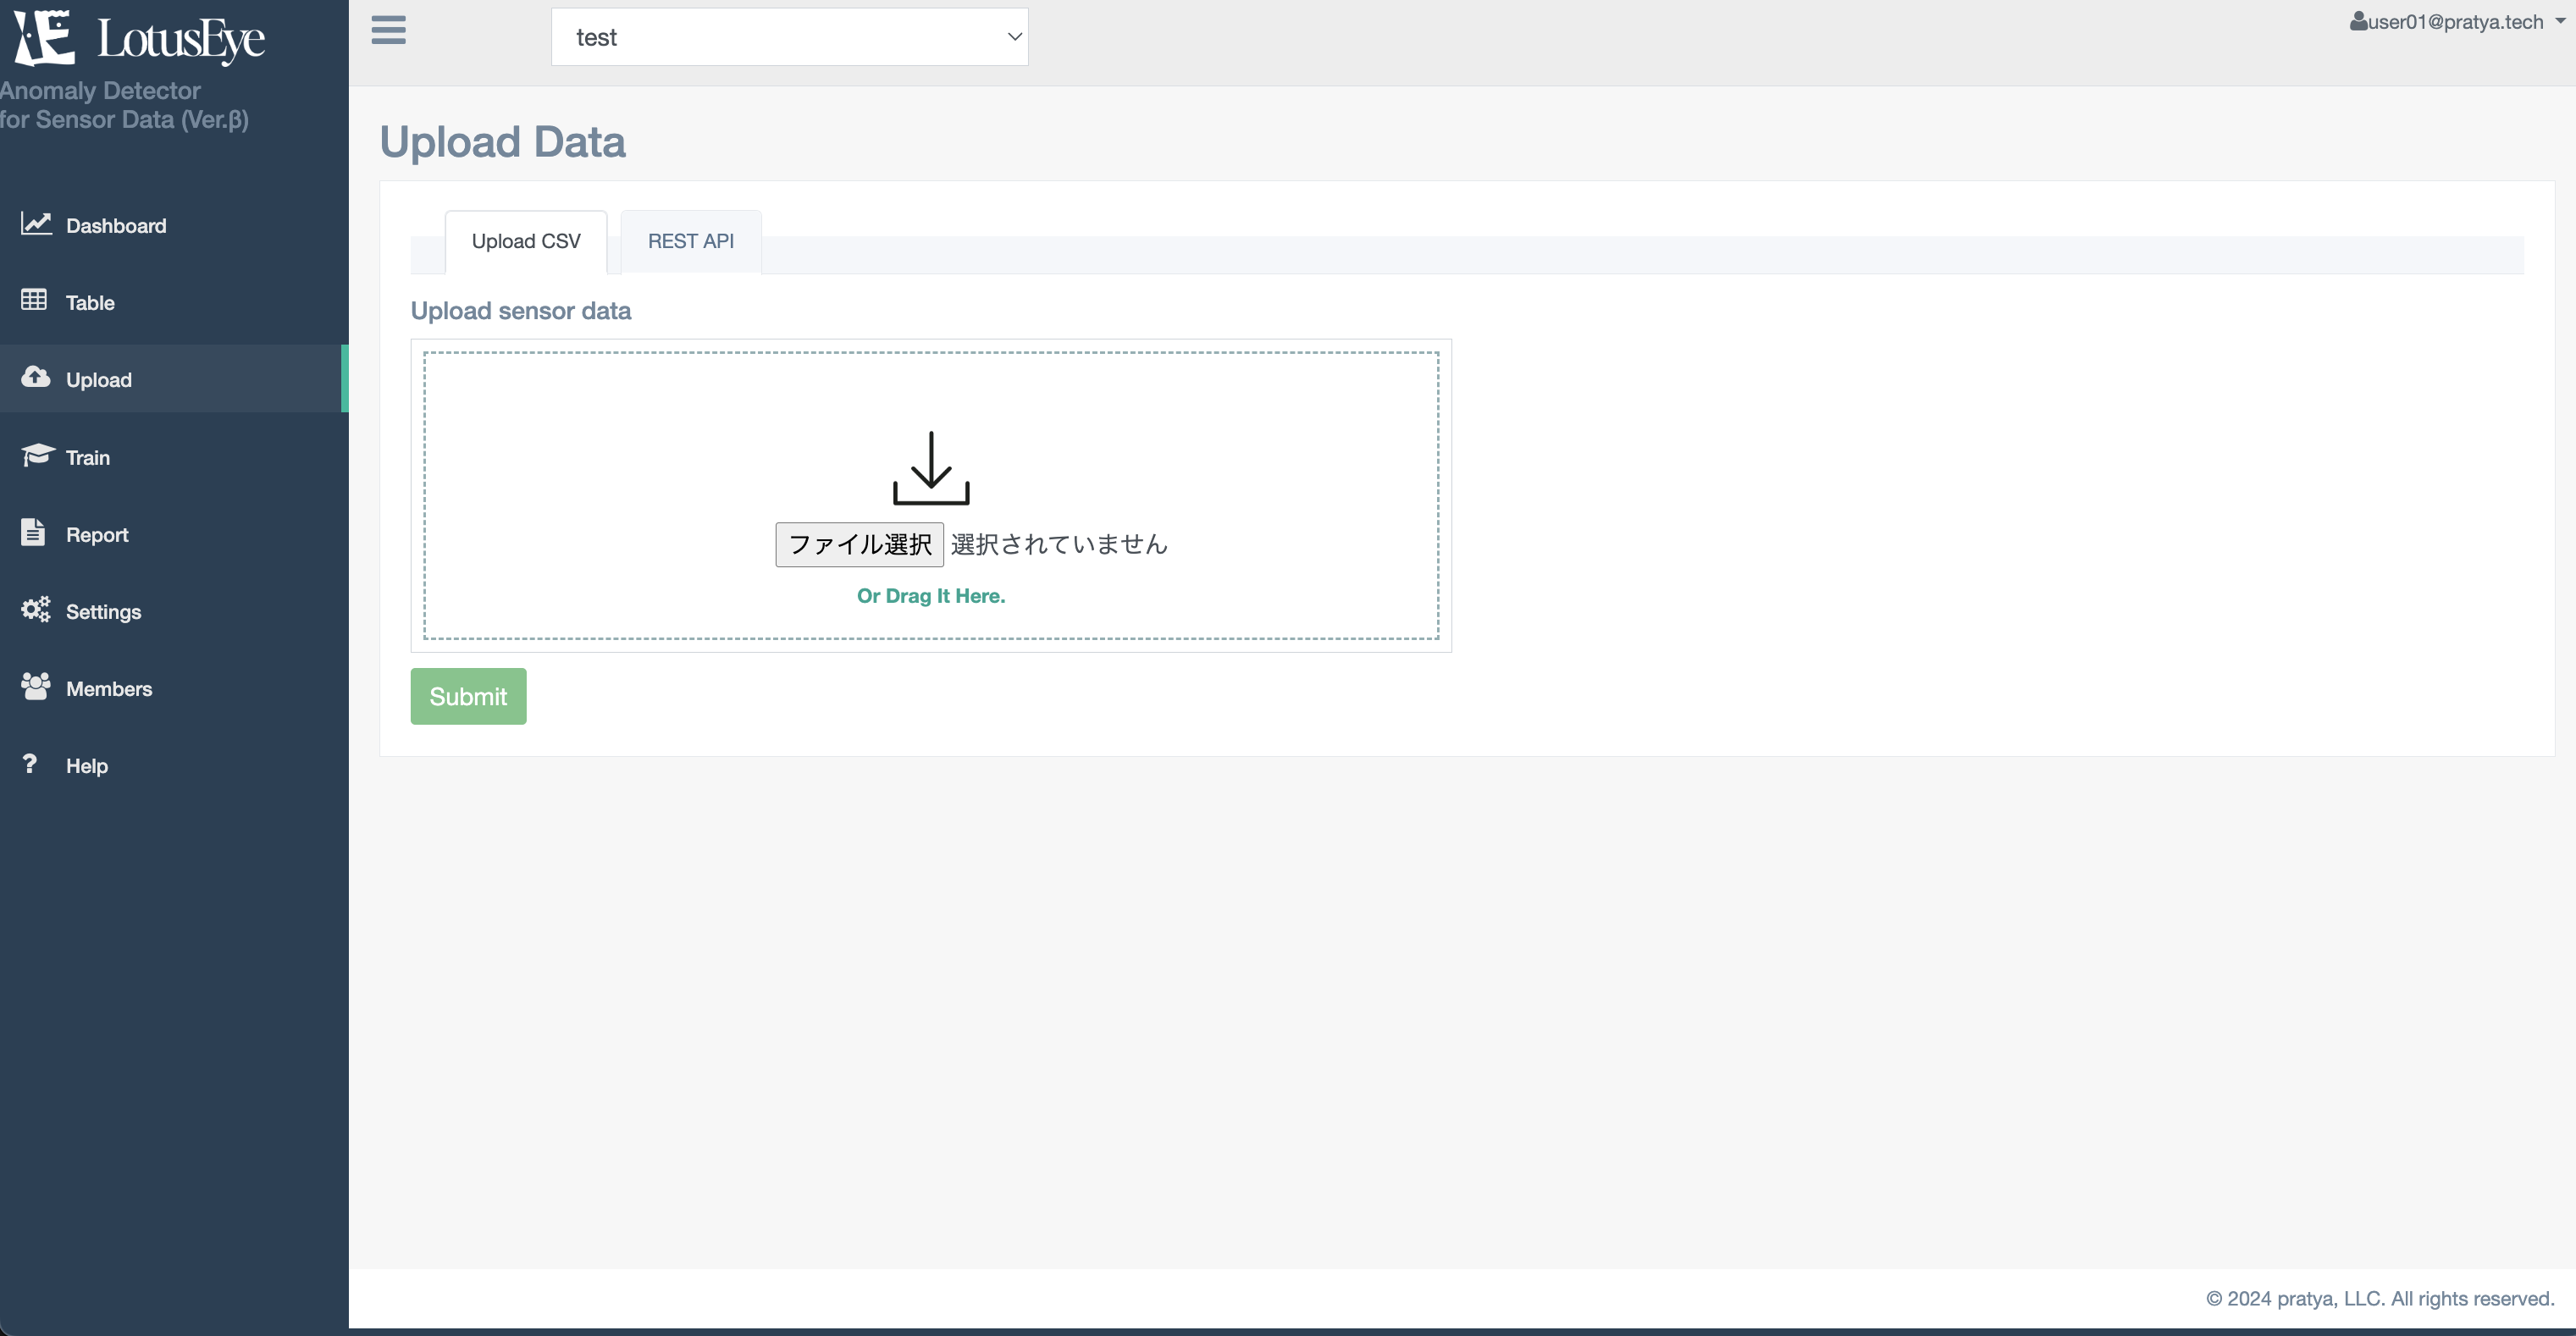
Upload test data for which you want to calculate scores. The uploaded data will be reflected in the sensor data on the dashboard screen
Manually upload CSV files from your PC. You can upload files by clicking "Choose File" to select a file or by dragging and dropping data into the dotted frame
This is an upload via API using cURL commands. By using cron or similar to periodically execute the command, you can automatically upload data.
An API key is required for uploading via API. Click "Create/Update API Key" to create an API key. The API key is only displayed at the time of creation, so please make sure to save it. If you forget to save it or want to change it due to key leakage, etc., click "Create/Update API Key" to create a new key.
The following is an explanation of the cURL command:
- csv_file_path: Please enter the path of the CSV file you want to upload
- your_api_key: Please enter your API key
Example: cURL command when the upload page URL is "https://lotuseye.co.jp/PROJECTID/api/upload/", the test data path is "/home/user/data.csv", and the API key is "AbCd1234.xxxxxxxxxxxxxxxxxxxx"
                curl -X POST -F file=@/home/user/data.csv "https://lotuseye.co.jp/PROJECTID/api/upload/"
                -H "X-Api-Key: AbCd1234.xxxxxxxxxxxxxxxxxxxx"
Upload data to train the AI model. When data is uploaded, an AI model is created and the scores calculated by the new model are reflected on the dashboard screen.
Manually upload CSV files from your PC. You can upload files by clicking "Choose File" to select a file or by dragging and dropping data into the dotted frame
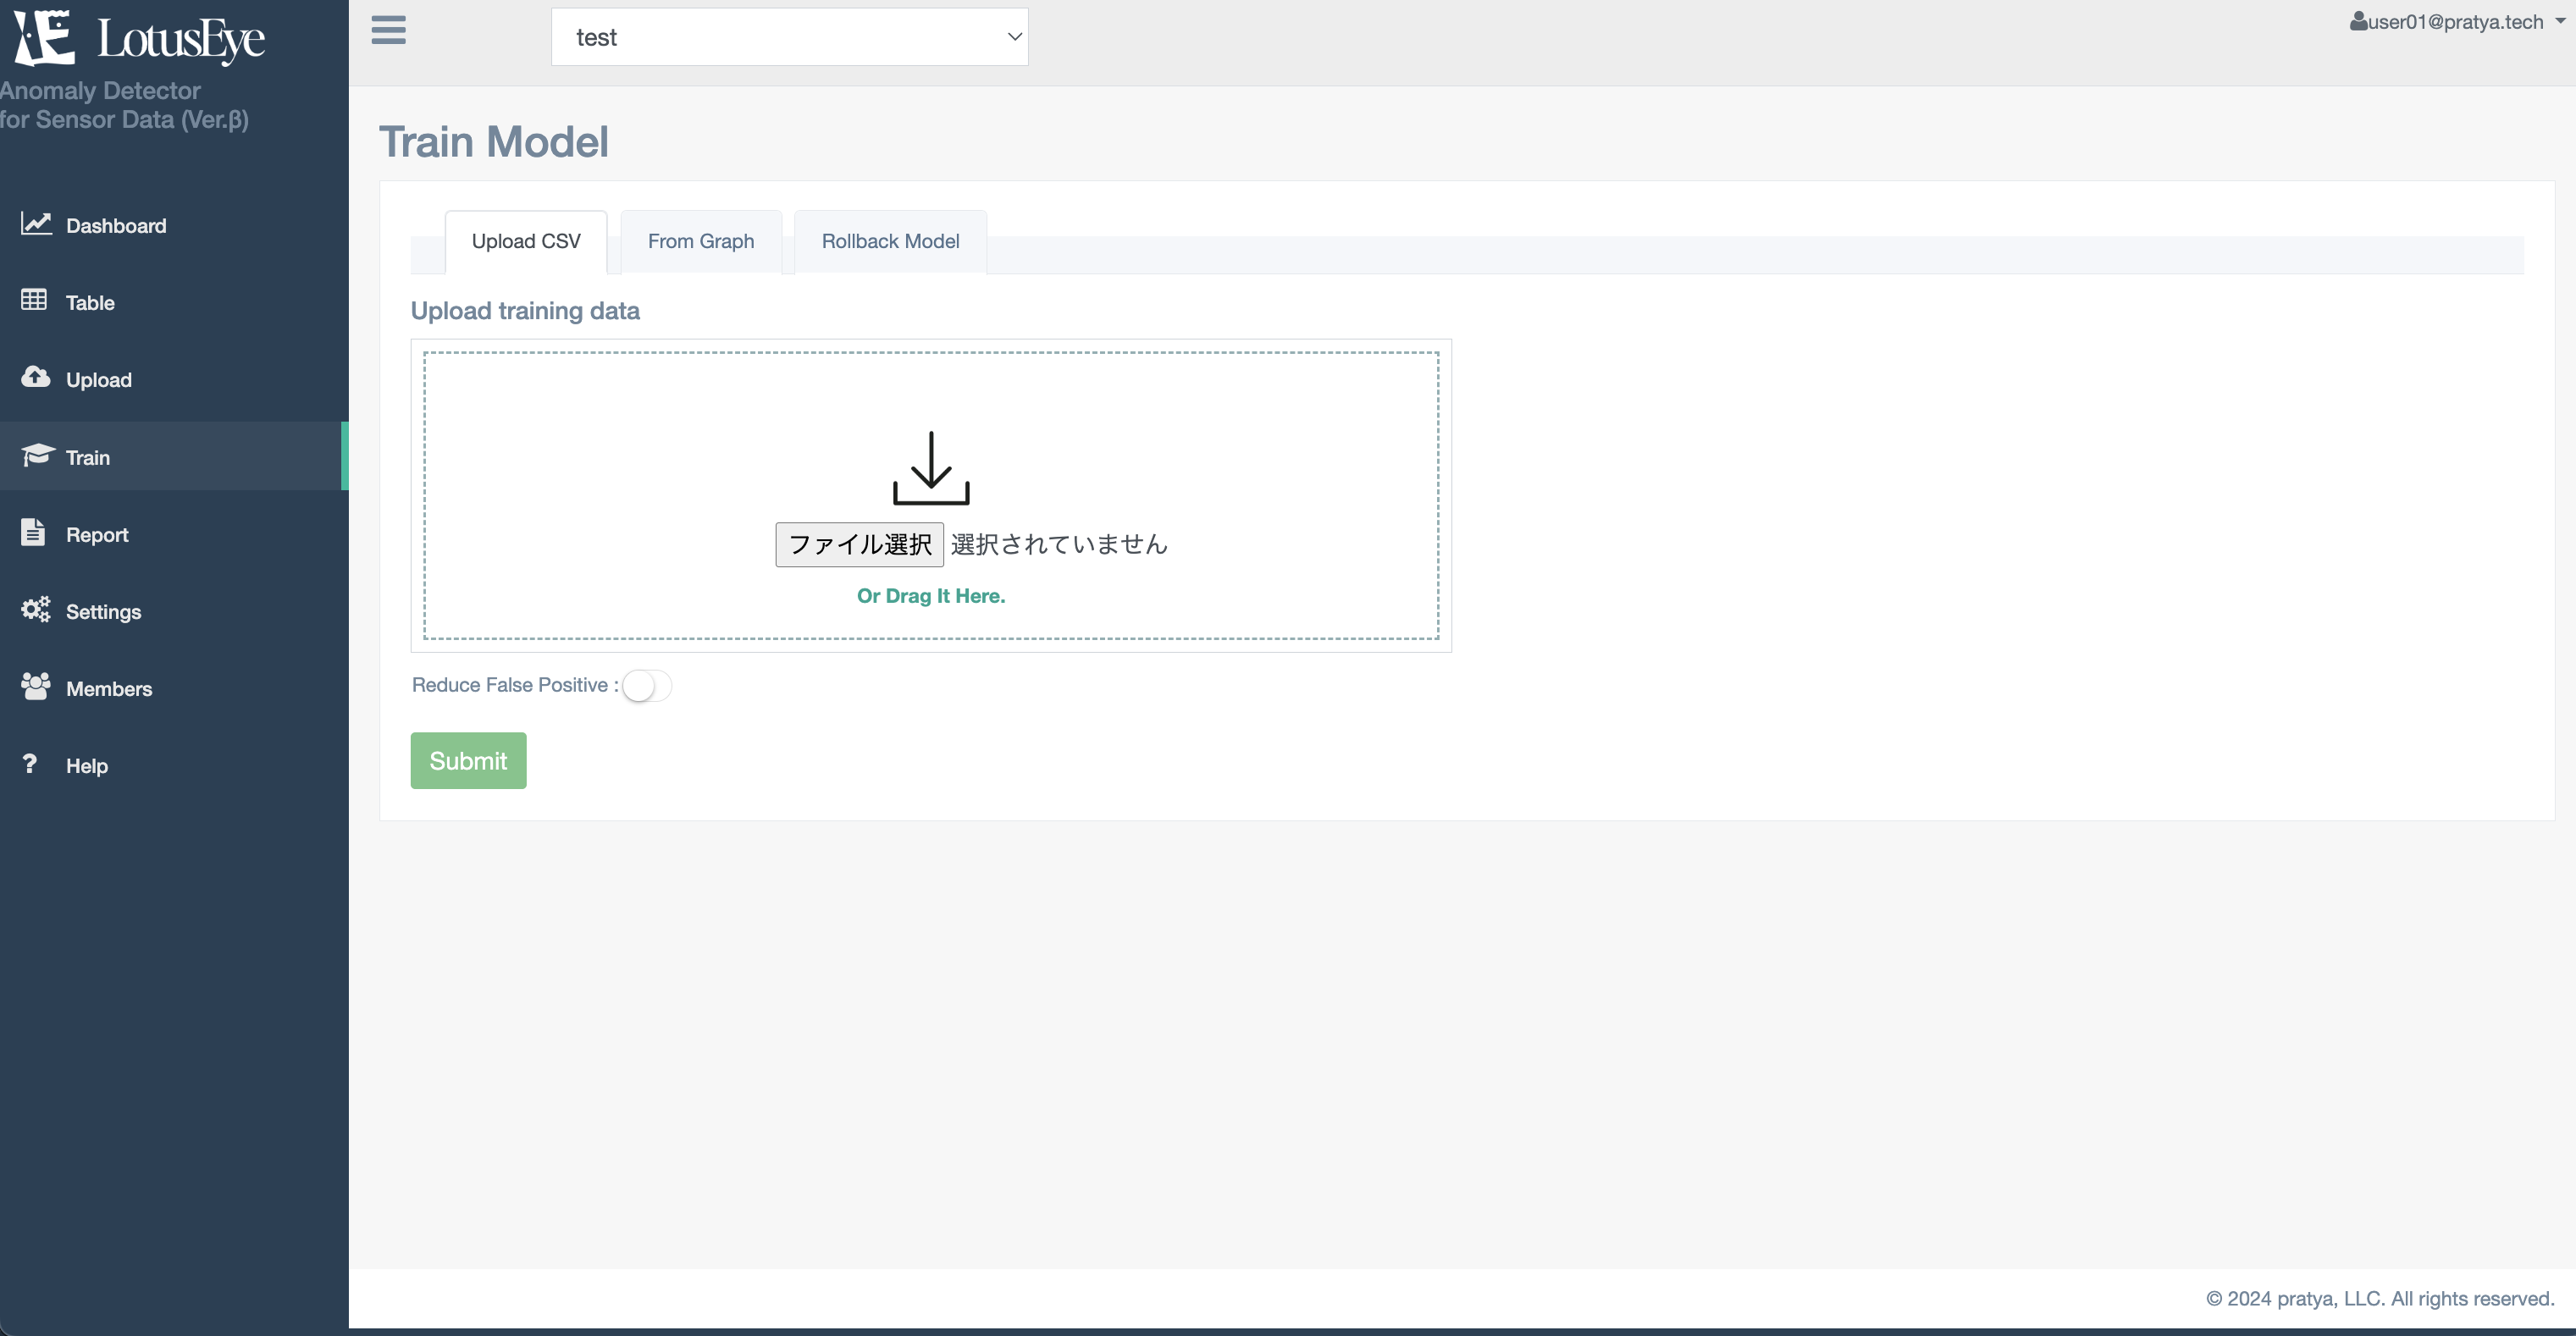
For information about the false positive reduction mode, please refer to 3-4-4. False Positive Reduction Mode
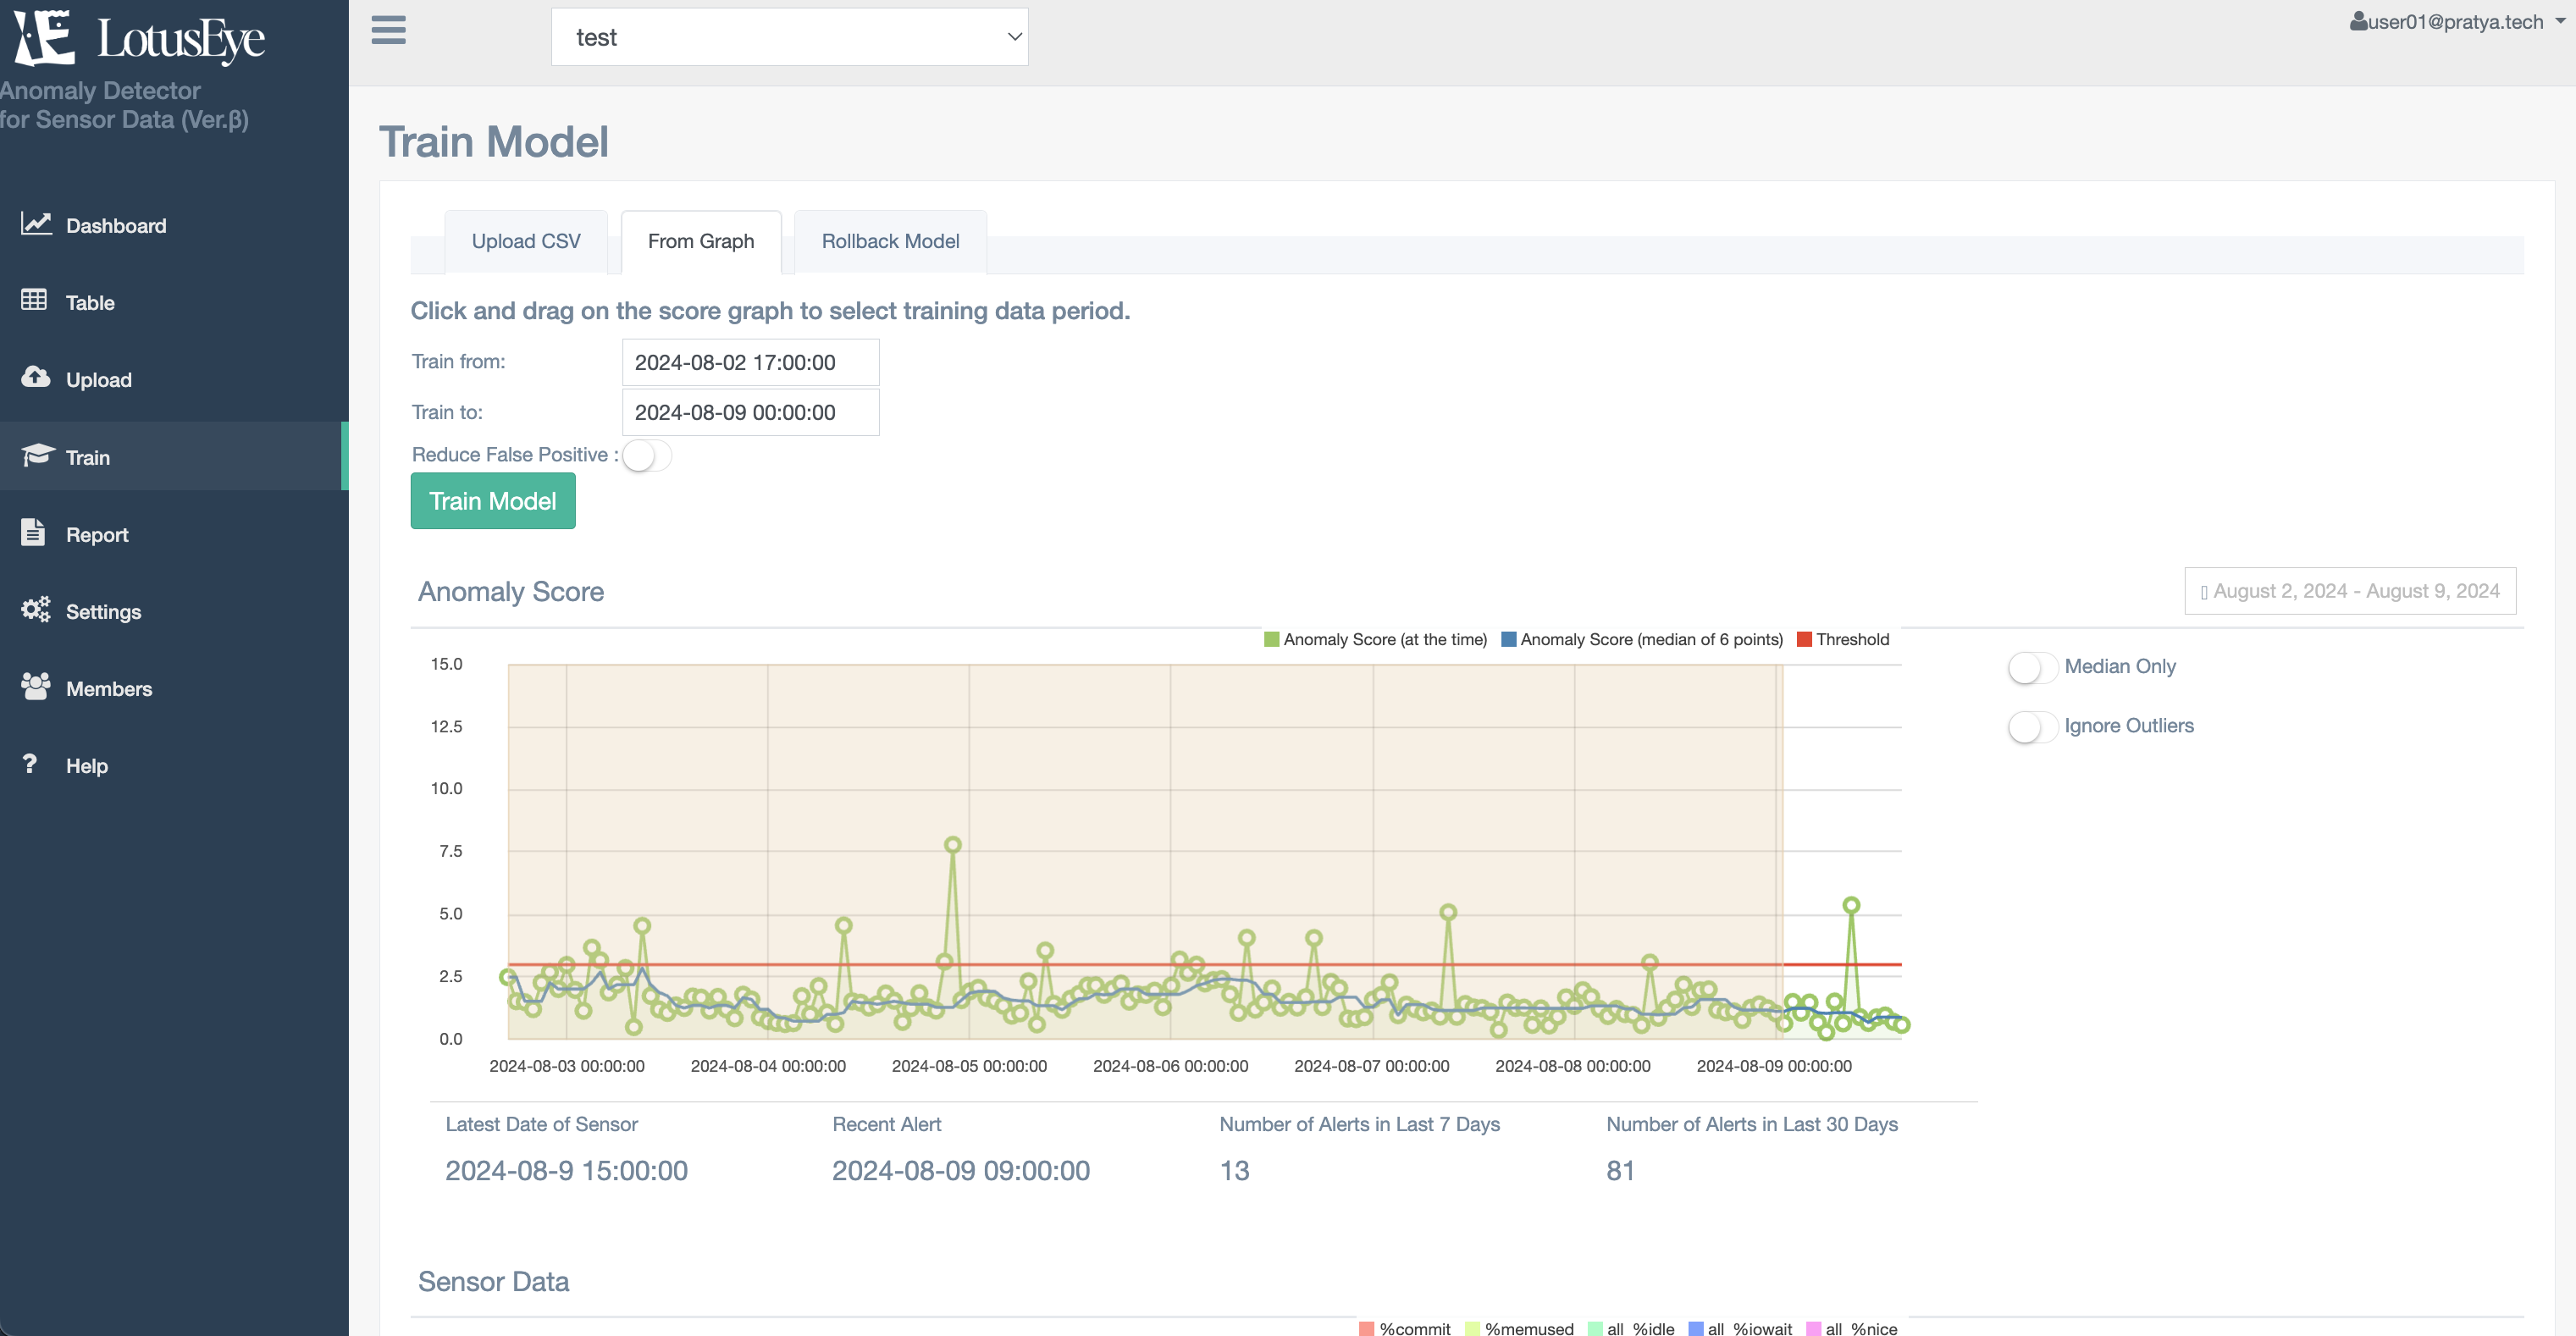
You can create a new model using test data from the period selected on the anomaly score graph. We recommend using this in the following cases:
- When there is insufficient training data. You can use the test data accumulated so far to create models, allowing you to gradually develop the model while accumulating data
- When the data trend has changed and false detections have increased. By recreating the model including recent data, you can create a model that reflects the change in trends
You can specify the period to use as training data by clicking and selecting a range on the anomaly score graph. Check the "Training data start date" and "Training data end date", and if there are no issues, click "Create Model". Here are some points to note regarding period selection:
- If the training period is too short, an error message will be displayed and you won't be able to create a model. The number of hours in the training period needs to be at least twice the number of sensors (e.g., if there are 10 sensors, at least 20 hours)
- The length of the training period that can be taken depends on the plan. For details, please refer to 7. Pricing Plans
For information about the false positive reduction mode, please refer to 3-4-4. False Positive Reduction Mode
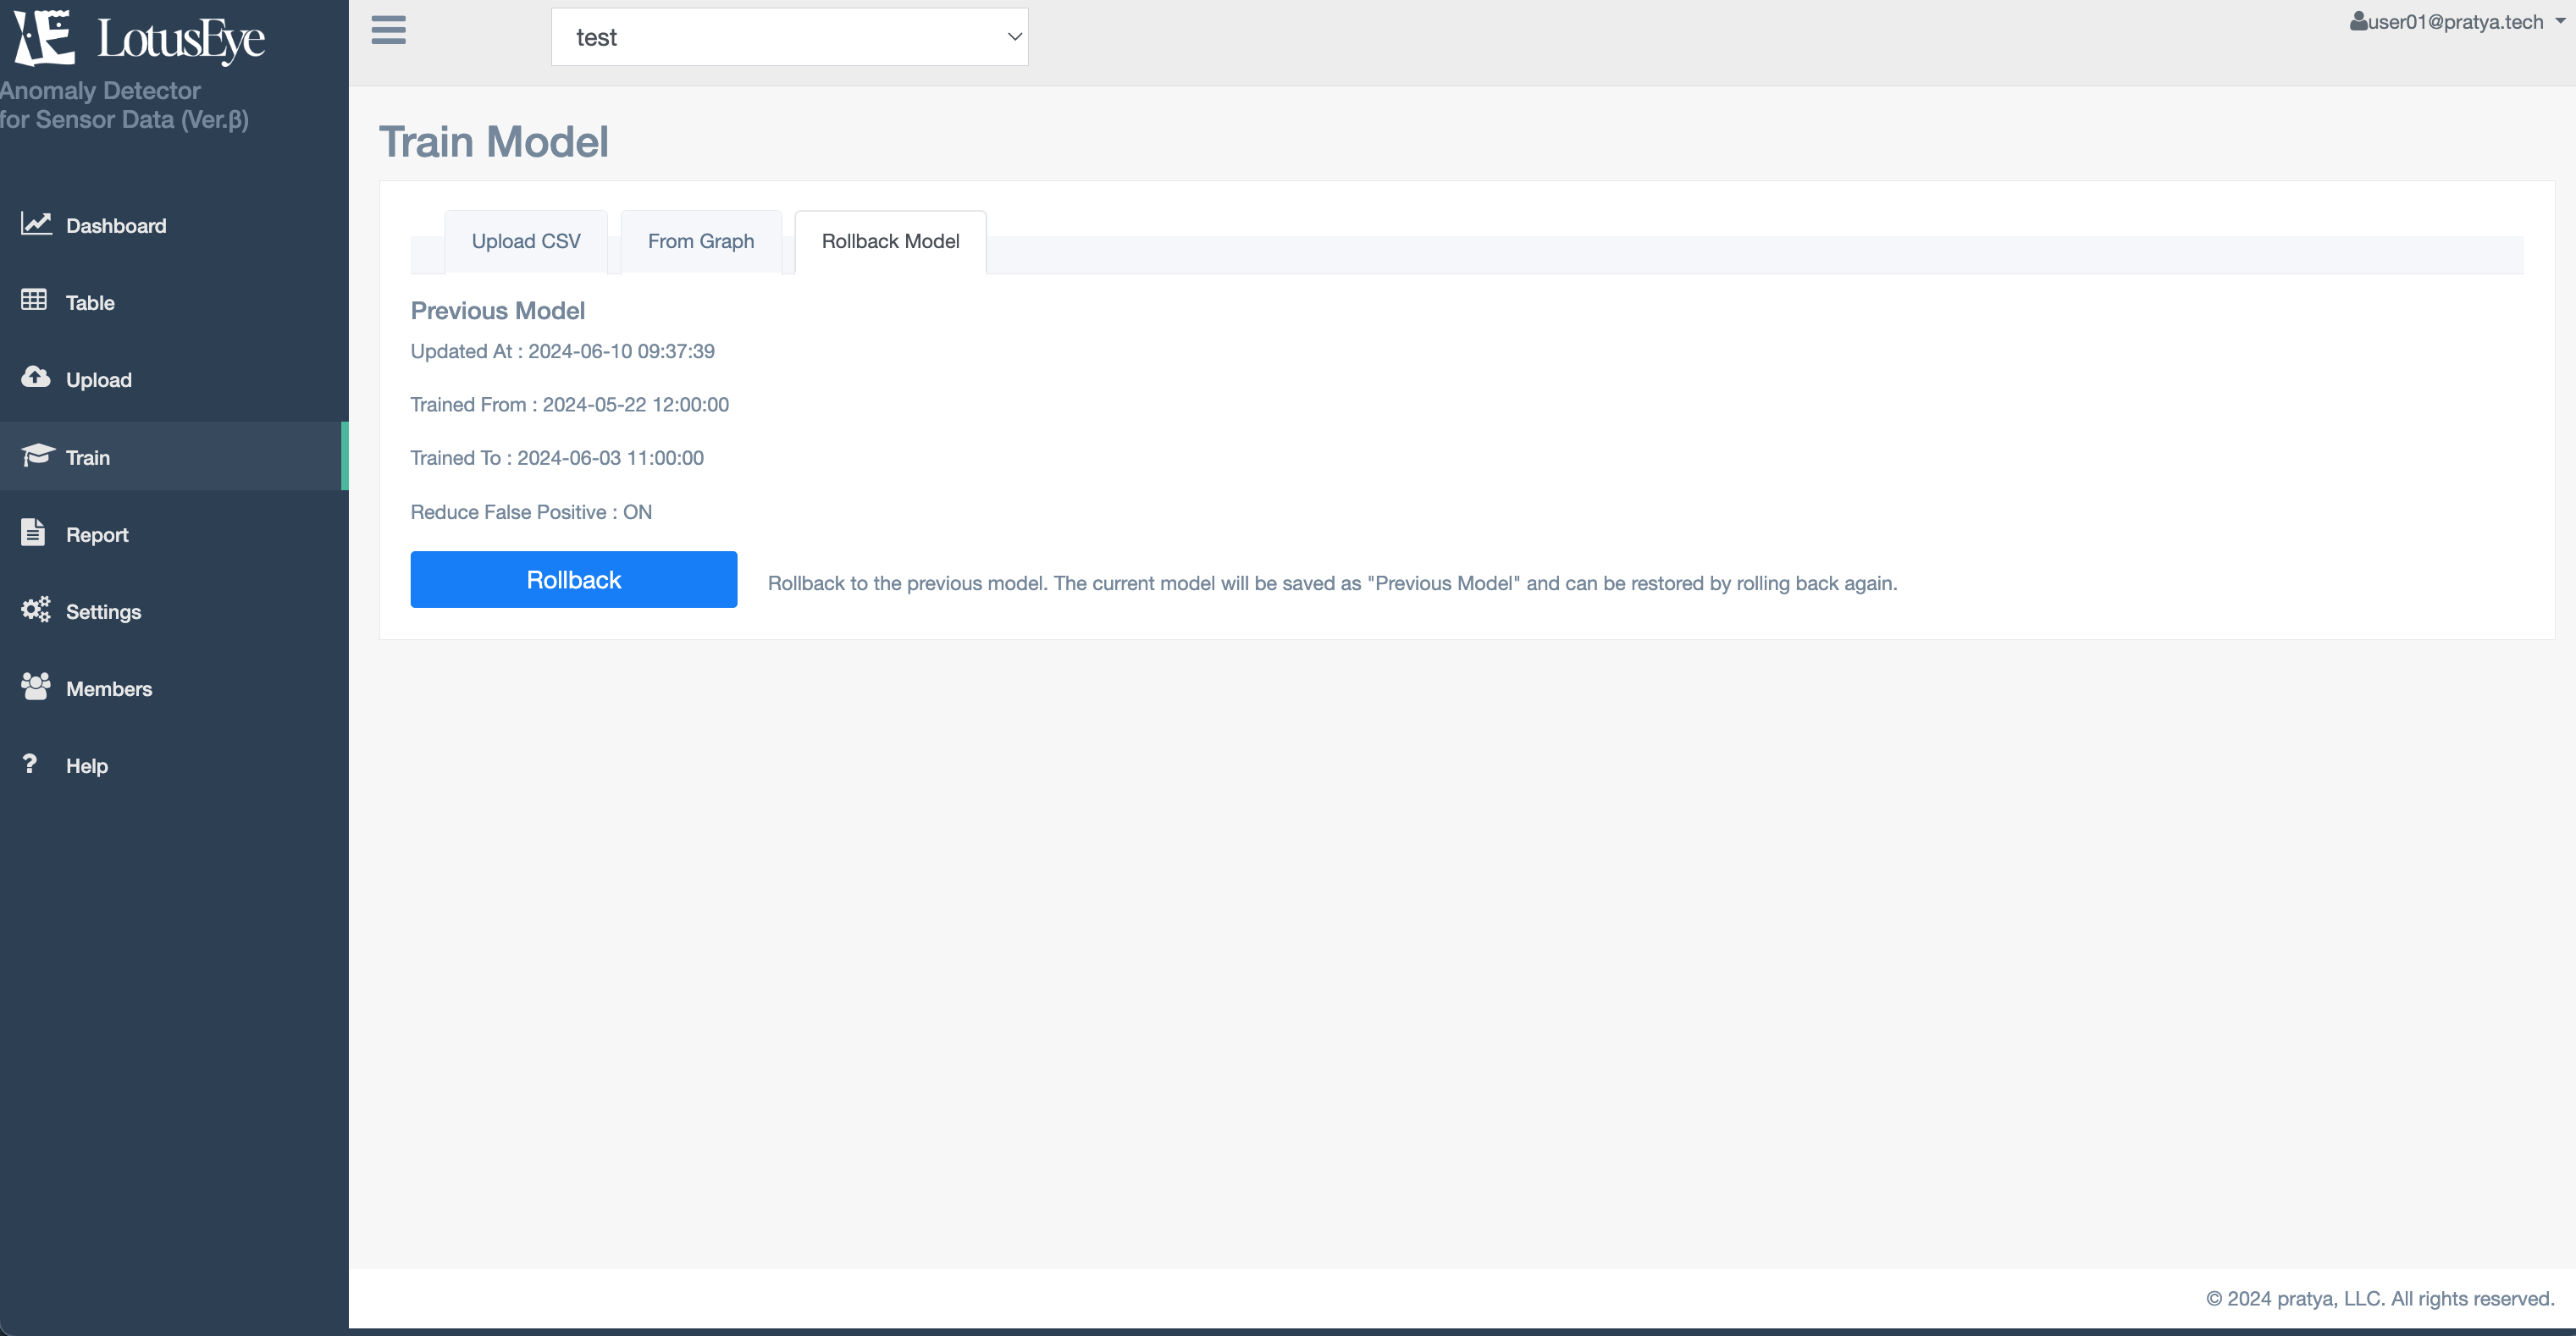
You can revert the AI model to the previously created model. The screen displays the date and time when the previous model was created (Model update date), training data start/end date, and whether the false positive reduction mode was used.
When you click "Rollback", the model will be reverted to the previous model, and the anomaly scores on the dashboard screen will be updated. Note that when you perform a rollback, the current model at that point is saved as the "previously created model". Therefore, if you perform a rollback twice, you will not go back to the model created two versions ago, but will return to the current model again.
By turning ON the "False Positive Reduction Mode" when creating a model, you can create a model that is less likely to produce false positives compared to the normal model. We recommend trying the false positive reduction mode in cases where false positives are likely to occur, such as when sensor values fluctuate significantly.
Here are some points to note when using the false positive reduction mode:
- When the false positive reduction mode is ON, a more complex model is created compared to the normal model, so it may take more time to create the model and calculate scores for test data than the normal model.
- The false positive reduction mode is a feature to create a model that suppresses overall false positives. Therefore, it does not guarantee the resolution of specific false positives. Especially when the amount of training data is small, turning ON the false positive reduction mode may actually increase false positives in some cases. In such cases, please roll back the model and use a model with the false positive reduction mode turned OFF.
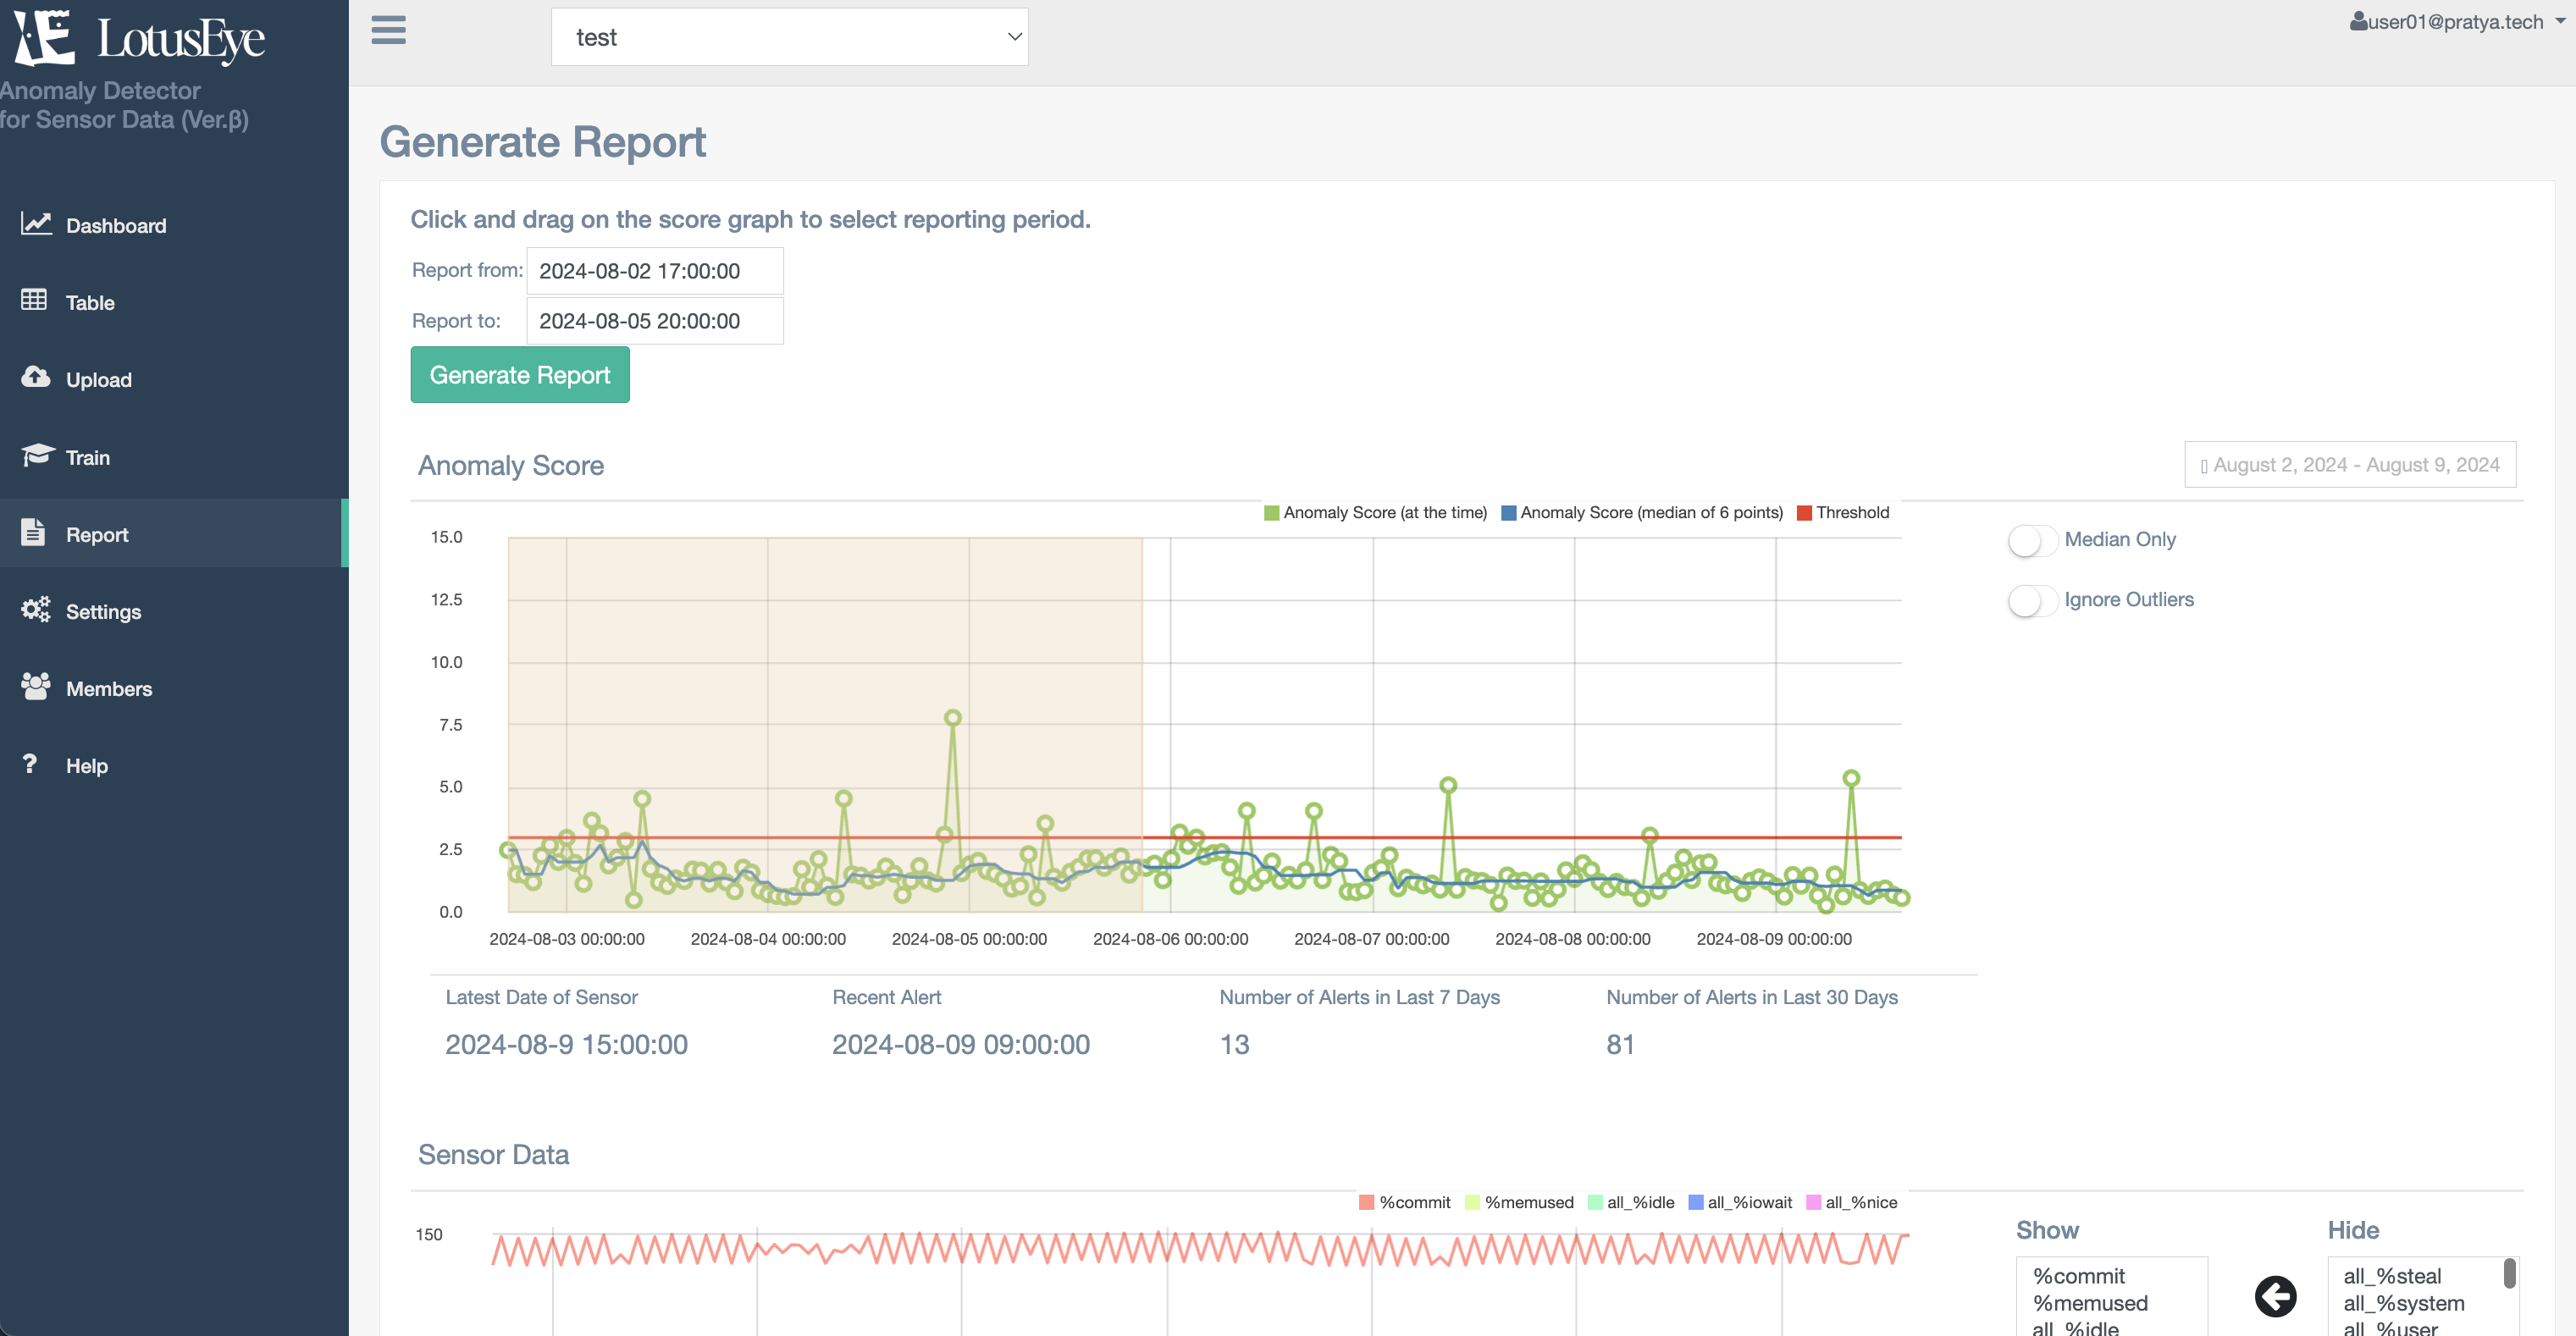
You can create a report that analyzes data from periods with high anomaly scores. In the report, you can check the following based on the "contribution" which represents how much each sensor value contributed to the increase in anomaly score at each time when the anomaly score exceeded the threshold:
- Top 10 sensors with high score contribution and their values
- Time series graphs of the top 5 sensors with high score contribution
You can create a report by selecting the target period on the anomaly score graph and then clicking "Create Report". Here are some points to note when creating a report:
- The report will be created for up to 24 hours when the anomaly score exceeds the threshold. If the period when the anomaly score exceeds the threshold is more than 24 hours in the selected period, the analysis data for the first 24 hours will be included in the report
- Since the analysis is performed for each time when the anomaly score exceeds the threshold, if there are many anomalies included in the selected period, it may take time to create the report. In such cases, you can shorten the time it takes to create the report by narrowing down the analysis target, such as shortening the selected period or including only the first few hours if the score continuously exceeds the threshold.
- When considering the factors of anomalies using the report, it is important to compare the trends of each sensor value during normal times and during anomalies. When selecting the target period, we recommend including a period when no anomalies occurred (period with low scores) and a period when anomalies started to occur (period when scores started to exceed the threshold).
You can change various parameters of the model and manage model initialization, creation, etc.
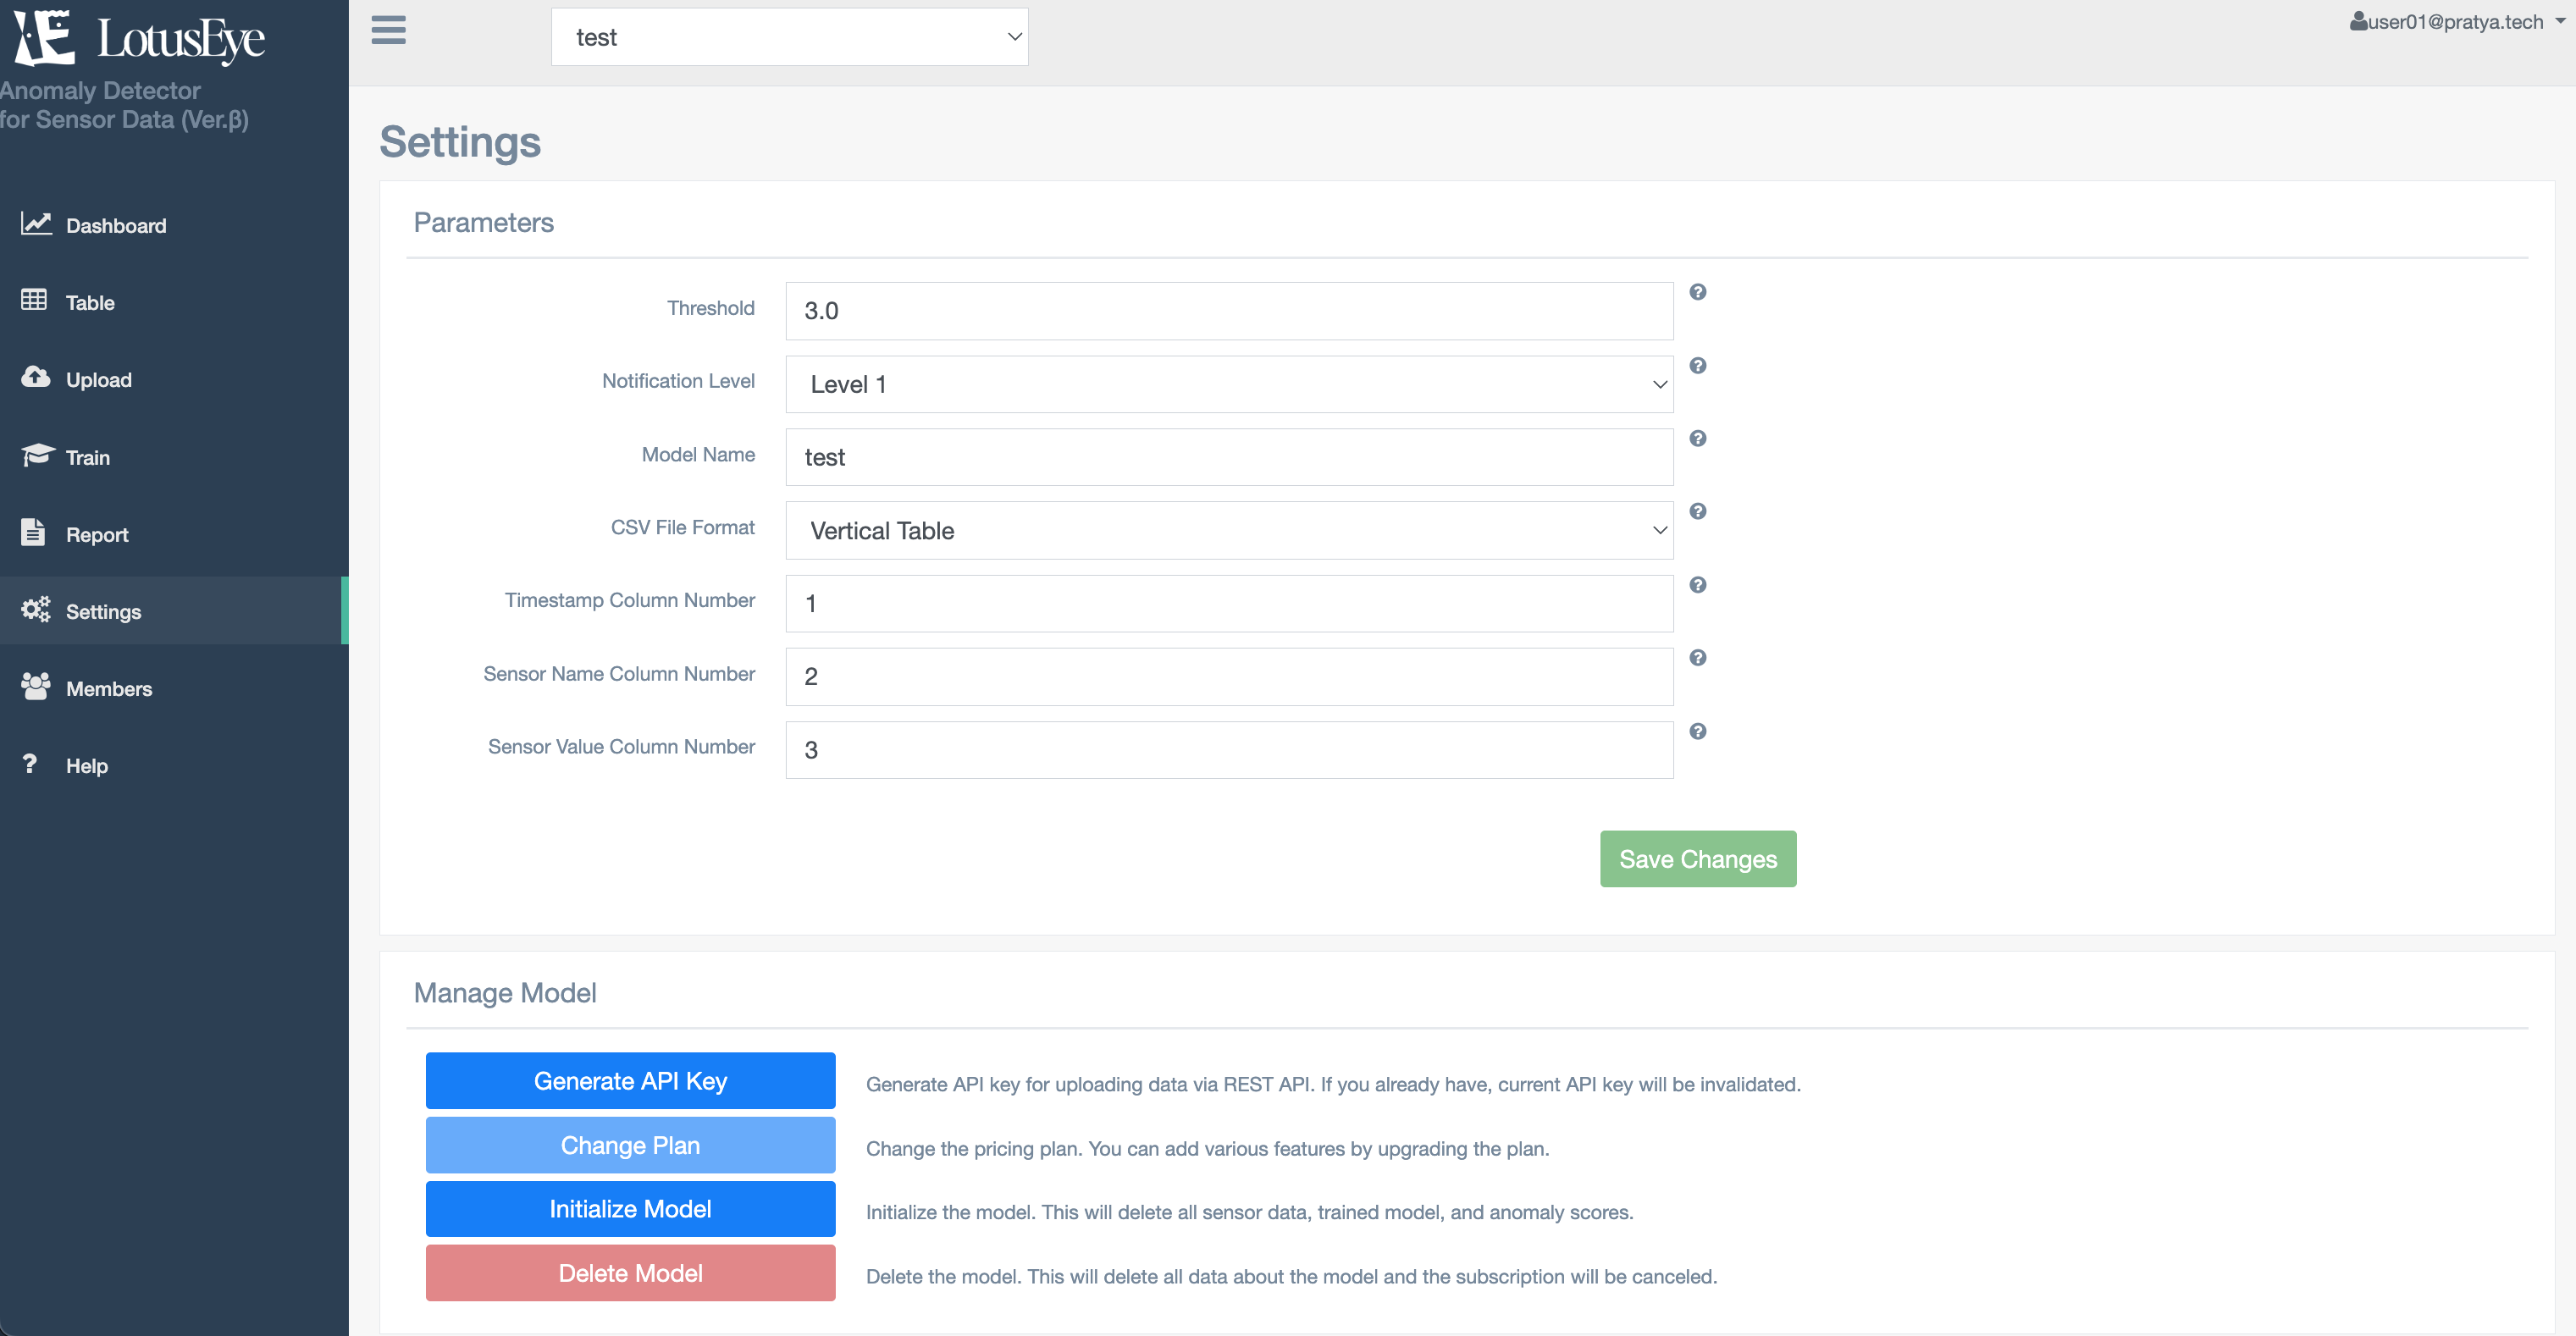
You can check and change various parameters related to the currently displayed model.
- Threshold: The threshold for the anomaly score. An anomaly is determined when the score exceeds this value (default value is 3). If there are many false positives, you can reduce them by increasing this value. If anomalies are being missed, you can make them easier to detect by lowering this value.
-
Notification level: Set the level at which alert emails are notified. Here are the
details for each level:
- Level 2: Notified when the score exceeds the threshold
- Level 1: Notified when the median of the scores from the past 6 time points exceeds the threshold. If there are many temporary score increases due to reasons such as noise in the sensor data, setting this level can reduce false detections.
- Level 0: Does not send alert emails. Set this if you want to stop sending alert emails.
- Model name: You can change the name of the model. The model name is displayed in the model selection box at the top of the screen.
- CSV file format: Specify the format of the CSV file to upload. Select either "Wide format" or "Long format" (For details on wide and long formats, refer to "CSV format" in 2-2. Model Creation)
- Timestamp column number: If you selected "Long format" for the CSV file format, specify the column number where the timestamp is written. In the case of the long format CSV sample, the timestamp column number is 1.
- Sensor name column number: If you selected "Long format" for the CSV file format, specify the column number where the sensor name is written. In the case of the long format CSV sample, the sensor name column number is 2.
- Sensor value column number: If you selected "Long format" for the CSV file format, specify the column number where the sensor value is written. In the case of the long format CSV sample, the sensor value column number is 3.
You can perform various management tasks related to the currently displayed model.
- Create/Update API Key: Create an API key used for data uploading via API. For details, refer to 3-3-2. REST API.
-
Change pricing plan: Change the pricing plan for the currently displayed model. When you
select a plan, you will be redirected to the Stripe screen where you can change your
subscription. Here are some points to note about changing plans:
- You cannot change from a paid plan (Light, Standard, Business) to a free plan (Free). If you want to change to a free plan, please delete the model once and then create a new model with the free plan.
- When downgrading plans, such as from Standard to Light or from Business to Standard, the currently used model may not function properly due to feature restrictions. In such cases, please initialize the model after changing the plan and then create the model again within the feature range of the plan.
- Model initialization: Initialize the currently displayed model. When you initialize, all sensor data, trained models, and calculated anomaly scores will be deleted. When you initialize a model, or if you skipped model creation during the initial setup, the dashboard screen will look like this. By performing model training and test data upload, the anomaly score graph will be displayed on the dashboard.
- Model deletion: Delete the currently displayed model. If you delete a model, and if you have created other models, you will be redirected to the dashboard screen of a model other than the deleted one. If no other models exist, you will return to the initial setup state. If you delete a model on a paid plan, the subscription will be automatically cancelled.
Create a new model. When you click the "Add Model" button, you will be redirected to the initial setup screen where you can configure a new model. Note that you can only have one Free plan model per account, so if you are already using a Free plan, you cannot create a new Free plan model.
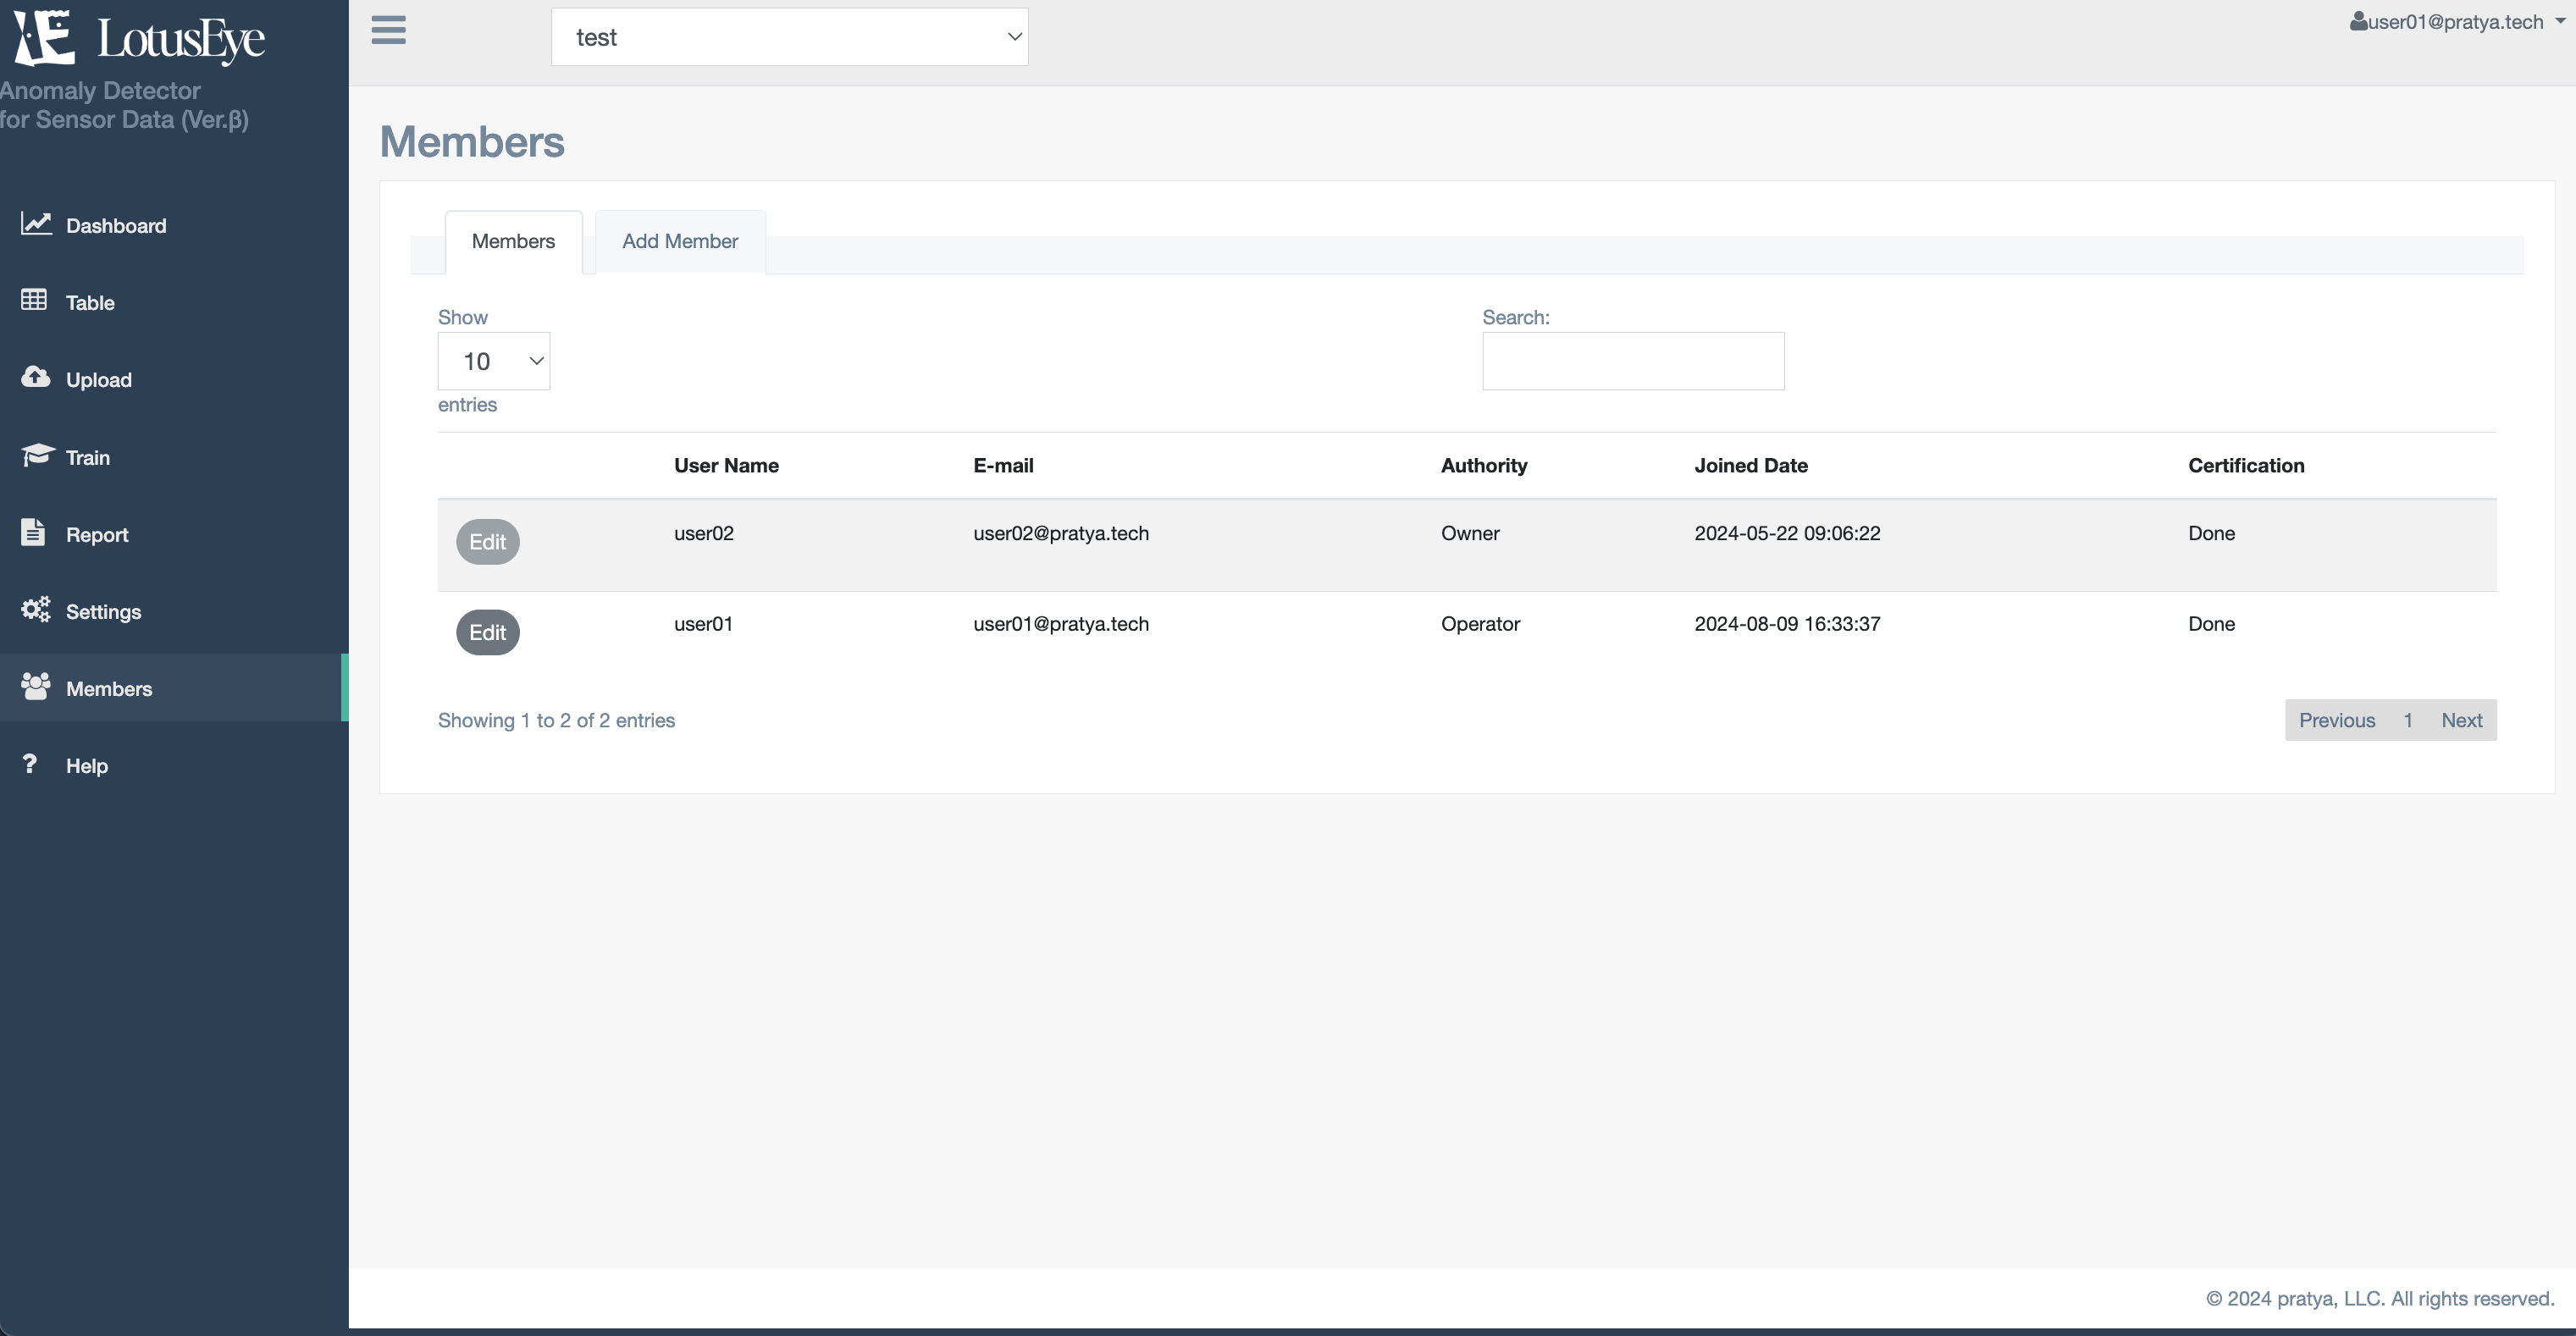
You can manage members who use the model.
You can check the list of members. By clicking the "Edit" button, you can change member permissions or delete members.
- Username: The username of the member is displayed
- Email address: The email address of the member is displayed
- Permission: The permission of the member is displayed. For details on permissions, please refer to 4. About User Permissions
- Join date: The date and time when the member joined is displayed
- Authentication: The authentication status of the member is displayed. If authentication has been completed from the authentication email sent at the time of addition, it will display "Completed". If authentication is not completed, a "Resend Email" button will be displayed. If the authentication email has expired, please click "Resend".
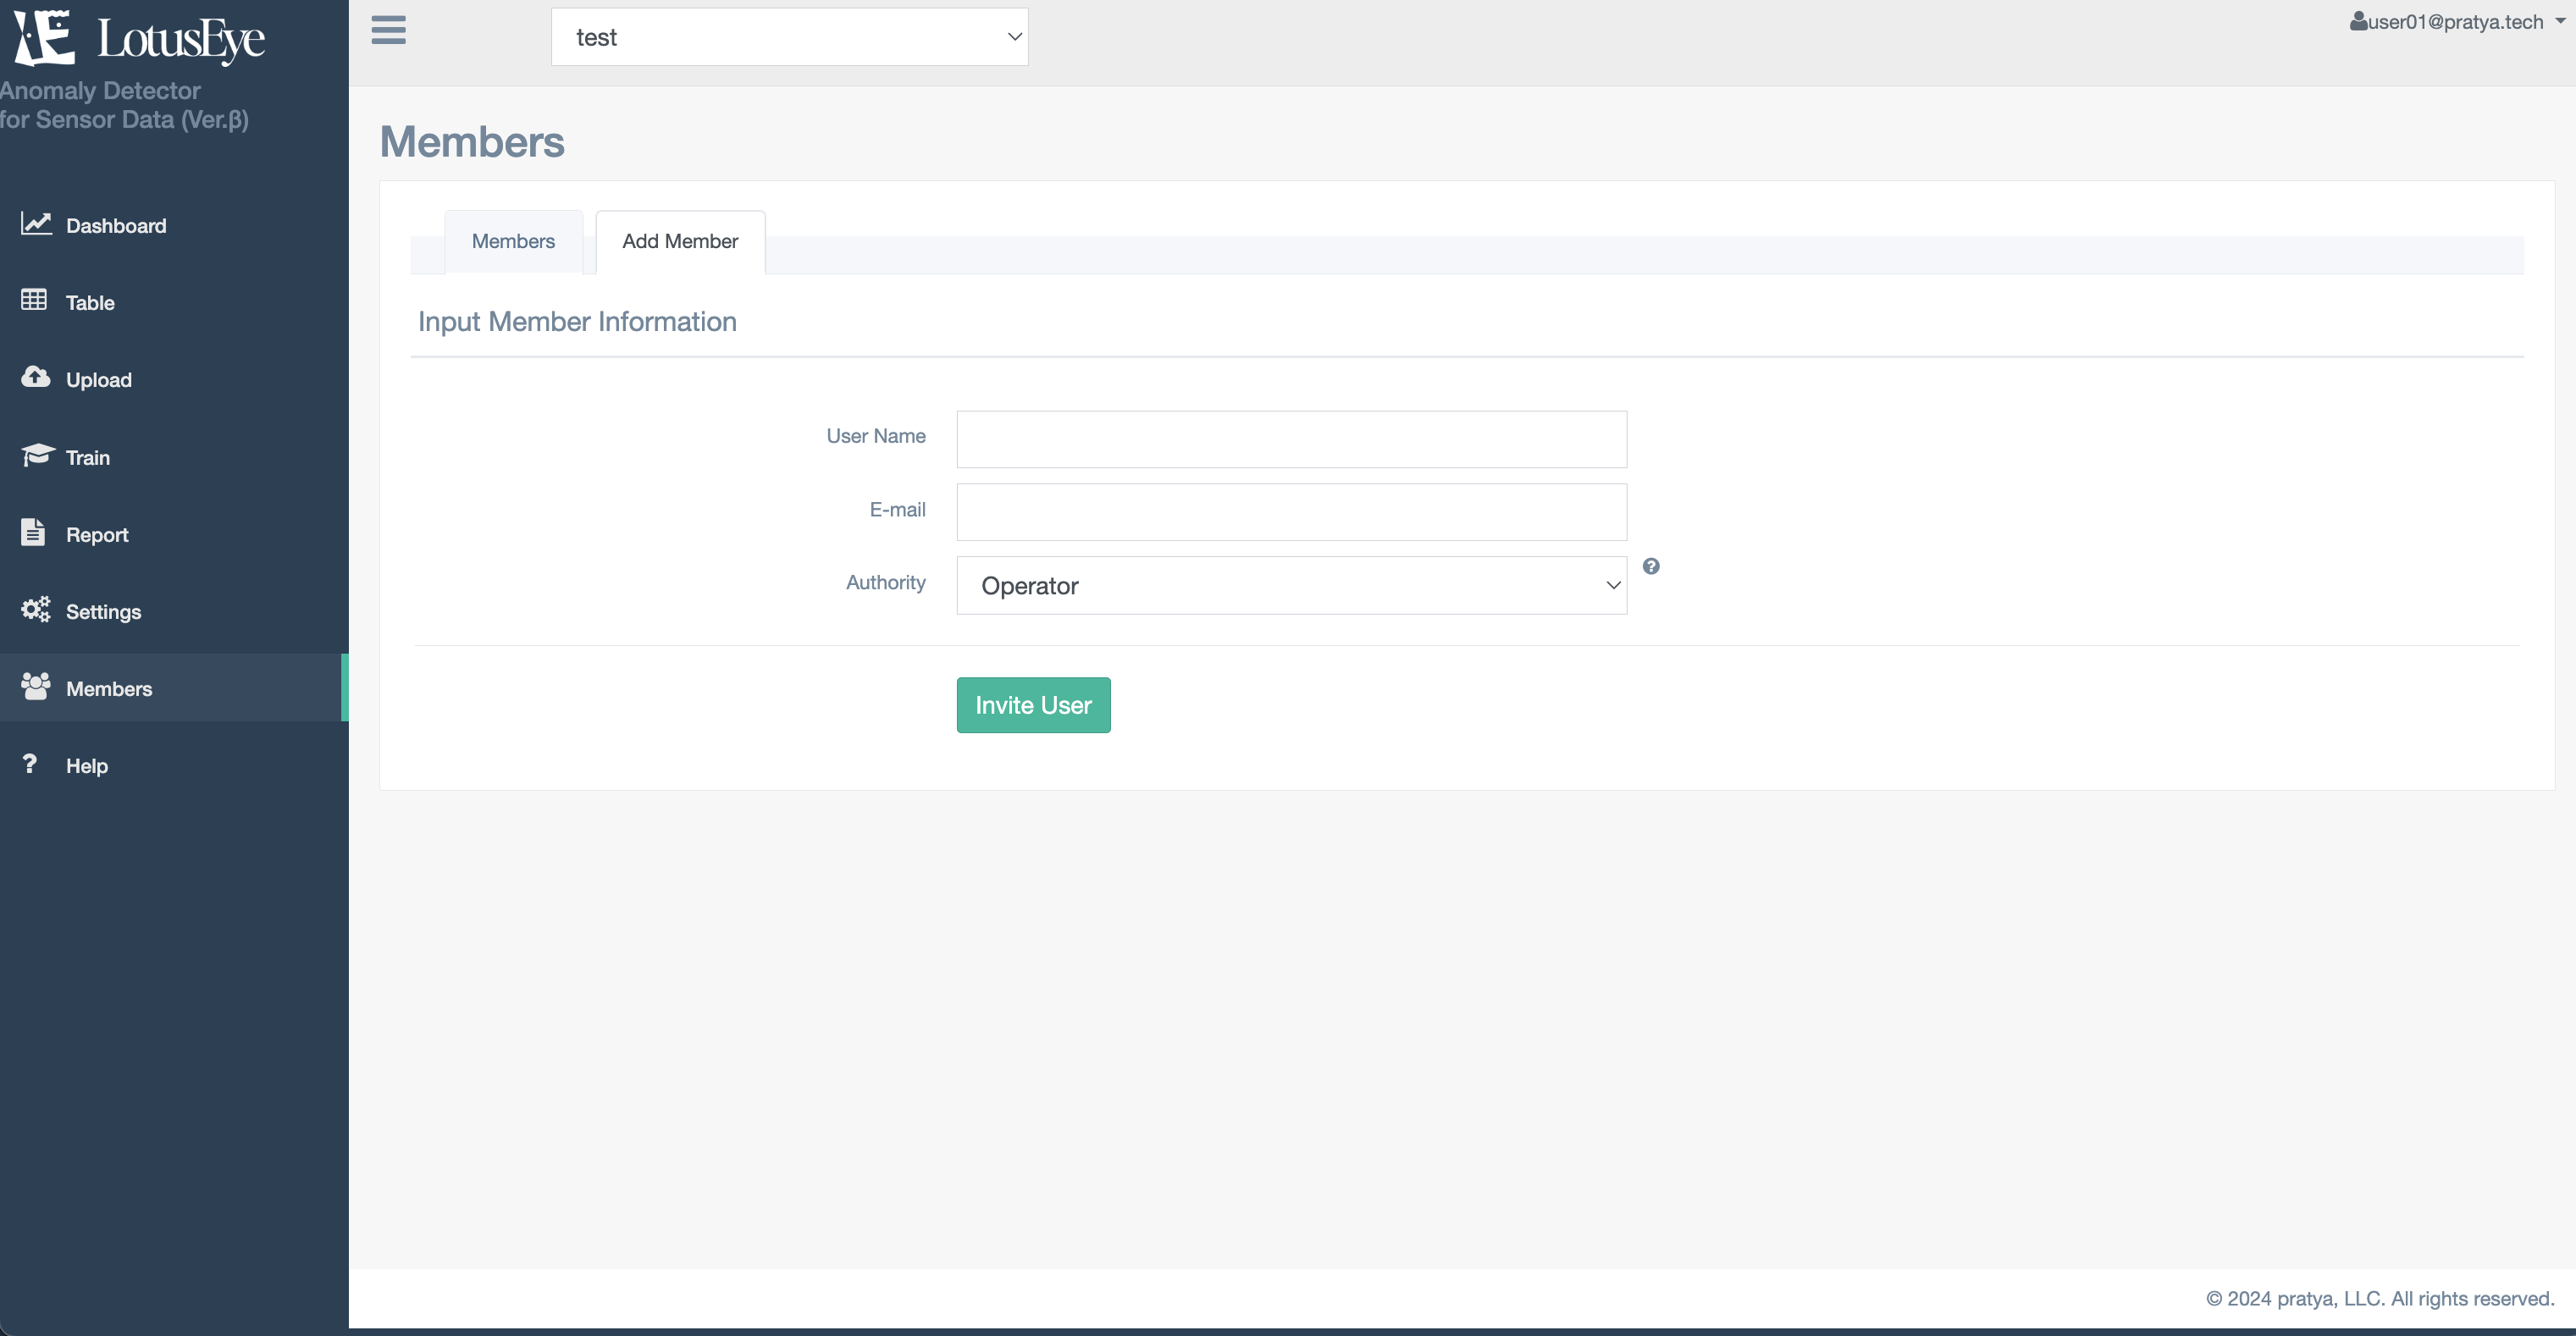
Add members who can use the model. Enter the information of the member you want to add and click the "Invite User" button to send an email. By clicking the URL in the email, the invited user will be able to use the model.
- Username: Enter the username of the member you want to invite. The username can be changed by the user later.
- Email address: Enter the email address of the member you want to invite.
- Permission: Select the permission you want to give to the invited member. For details on permissions, please refer to 4. About User Permissions.
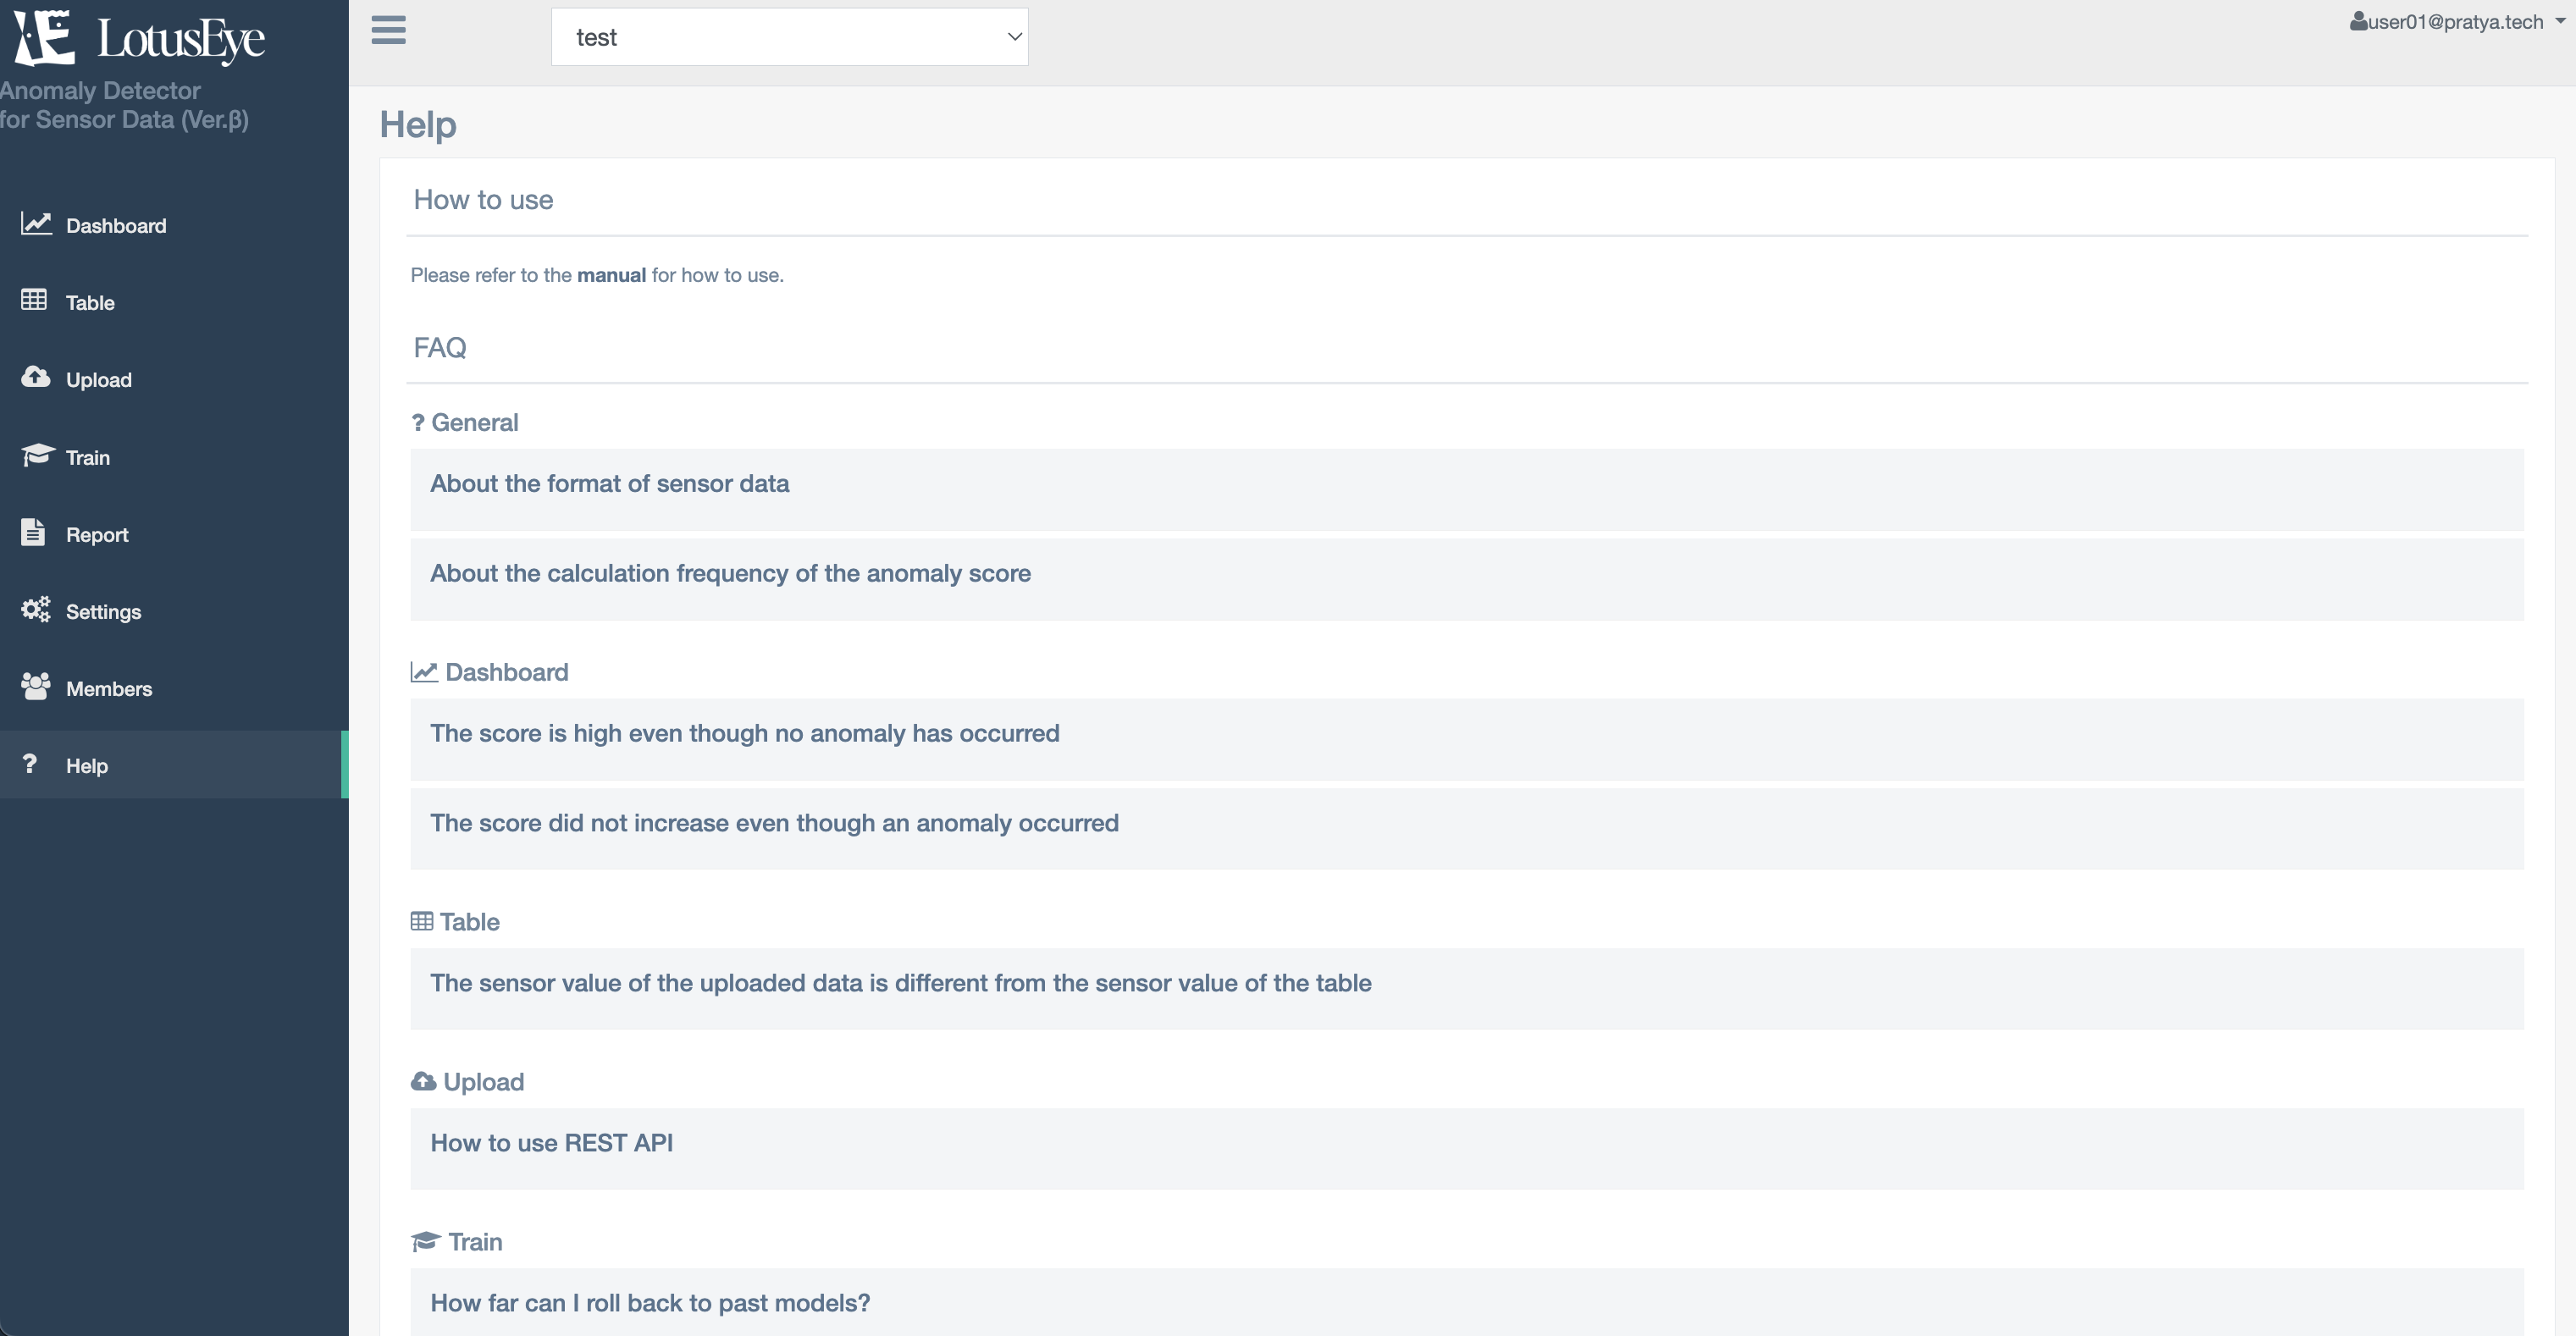
You can check frequently asked questions and their answers.
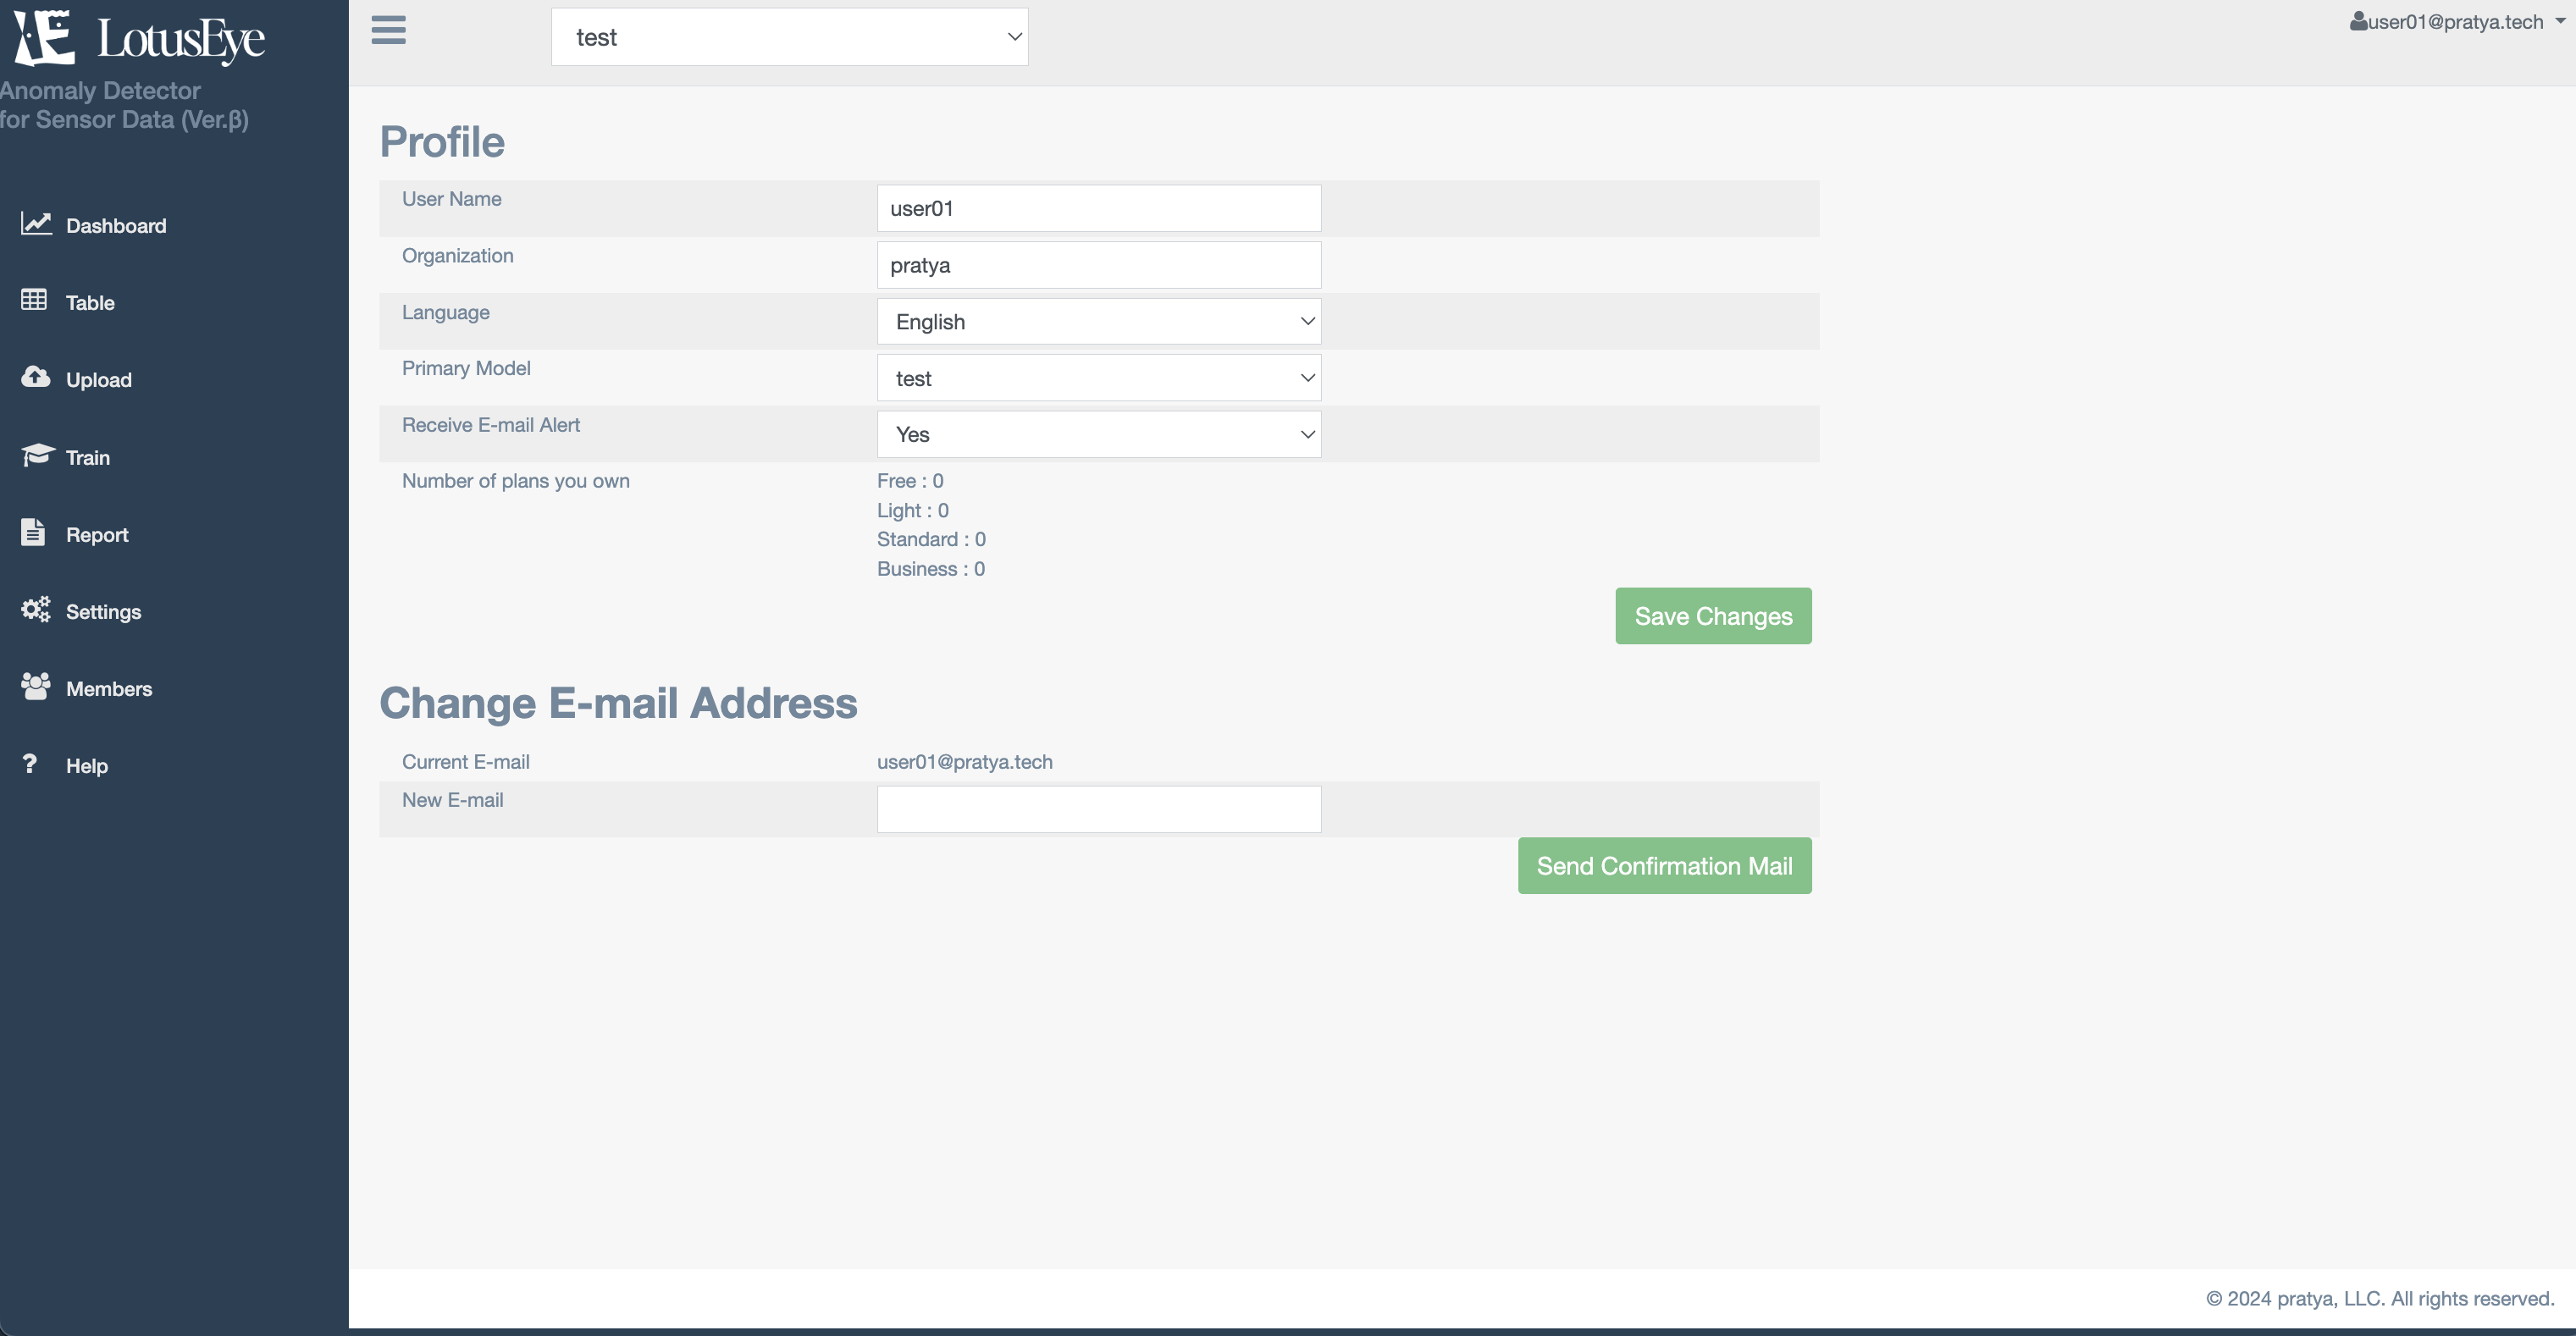
You can set the following items. You can also check the number of models for which the logged-in user has Owner permission.
- Username: You can change your username
- Organization: You can set the name of the organization you belong to
- Display language: You can select the screen display language from Japanese or English
- Main model: You can select the model that is displayed by default when logging in
- Receive alert emails: You can turn ON/OFF the reception of alert emails
- Email address: You can send a confirmation email to a new email address. You can change your email address by receiving the confirmation email and clicking the URL
If you want to change your password, please set a new password from Forgot Password on the login screen.
You can log out by clicking on the username (email address) in the upper right corner and pressing "Logout".
For information about pricing plans, please see here.
You can cancel your subscription by deleting the model. To delete a model, click "Model
Deletion" from 3-6-2. Model Management.
If you wish to delete your account information, please contact us at info[at]lotuseye.co.jp.